Introduction
Document vs Analysis object
While the pipeline concept in arivis makes it really efficient to create and process multitudes of objects, sometimes manually drawing objects is the fastest to create a region of interest.
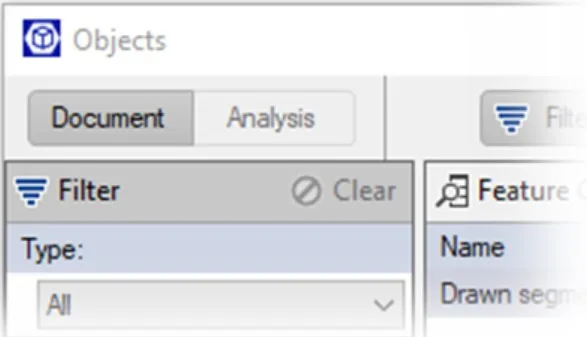
To facilitate the creation of multiple pipelines while still maintaining some order the pipeline created objects (Analysis objects) are kept apart from those previously created and saved (Document objects). When we are running a pipeline we can switch between seeing the Document and Analysis objects using the toggle at the top of the Objects table:
Manually drawing objects while a pipeline is running is not supported as the associated tags for the objects are not part of the pipeline. But that is not to say that manually created objects can't be used in a pipeline.
Potential use cases for manually drawn objects
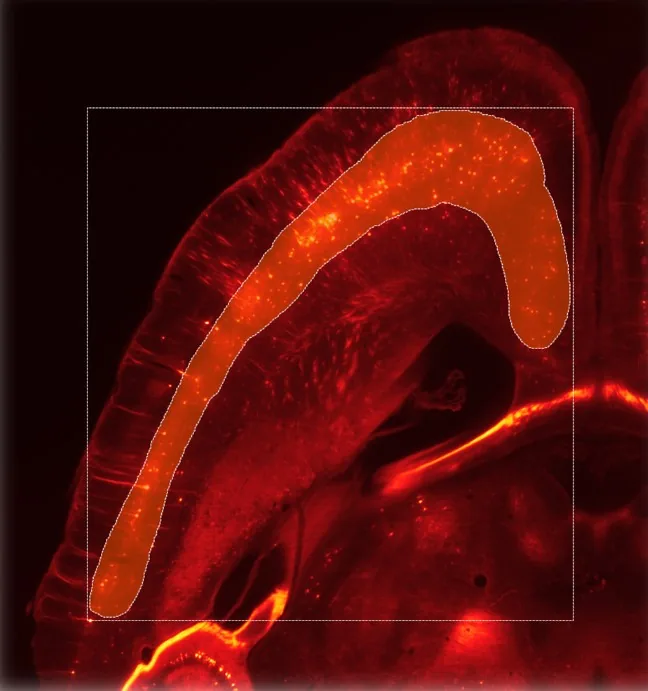
The most common reason we use manually drawn object regions in a pipeline is to limit the analysis to a specific portion of the image. To some extent we can do this using the Input ROI operation which is always first in the pipeline. However, the Input ROI is always a cuboid and we may be interested in measuring objects only within an irregular region of the image. For example, we may want to count cells in only this region of the image:
In the Input ROI operation we can limit what the pipeline has access to to match the bounds of the region we selected:
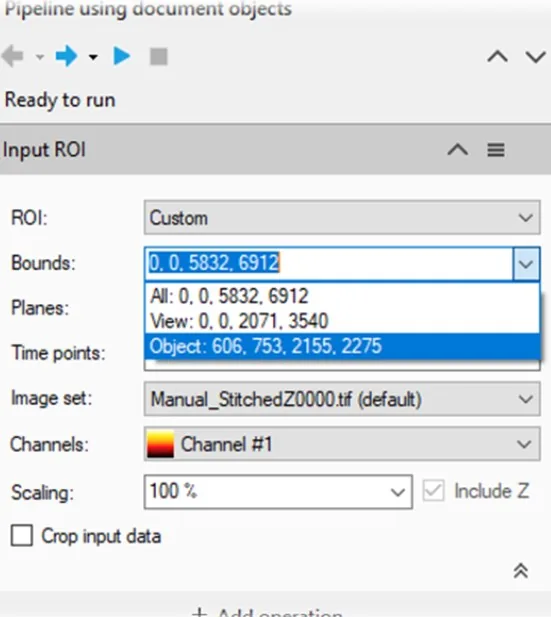
And we can do this for the planes as well if this is a 3D region. However, as mentioned above, this region will be a cuboid corresponding to the bounding box, not the irregular shape of the region. So in this case if we counted all the cells within the box we would not know specifically how many of those are within the drawn region.
Furthermore, the objects relationship to the region and the region's relationship to the objects might both need to be quantified. We may wish to know the distance of individual cells to the border of the region, or we may want to measure the numerical density (cells / unit volume). We might also want to use several regions simultaneously to compare statistics between the two. In this case having the object in the pipeline allows us to use the Compartments operation to measure such things.