Creating XYZ matrix of sub-volumes
This guide explains how to create a sampling volume (ROI) as a XYZ matrix of boxes. The application uses a Python script to create single or contiguous sub-regions that can be used as ROI for further analysis. The unique limit is related to the sampling volume shape. Only regular 3D boxes are available.
Opening the working dataset
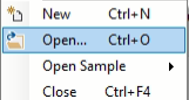
- Select Open... from the file menu.
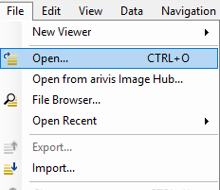
- Select the dataset from the file browser.
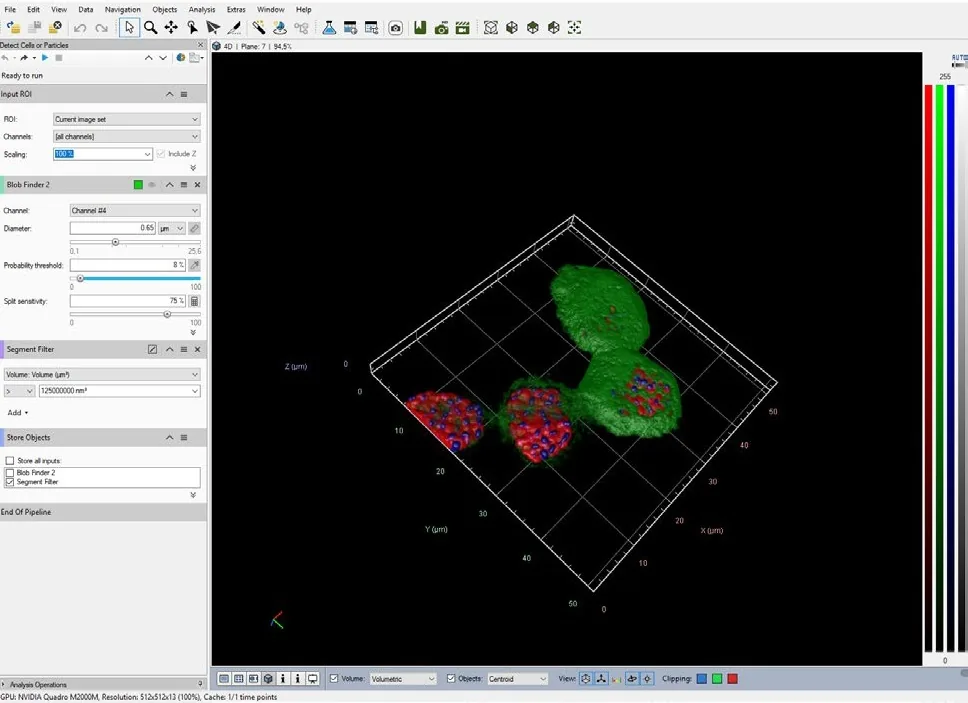
The dataset is a multi dimensional, discrete, representation of your real sample volume. It can be structured as a Z series of planes (Optical sectioning) of multiple channels (dyes) in a temporal sequence of time points (located in several spatial positions).
Usually, the dataset shows a single experimental situation (a complete experiment can be composed by several datasets). The datasets are available as graphic files saved in plenty of file formats (standard formats as well as proprietary formats).
Note: The dataset is visualized according to the current rendering setting parameters. Refer to the arivis Pro Help for more details.
Loading the Python script
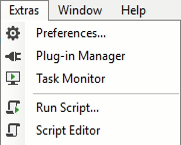
- Open Python Script Editor. From the Extra menu, select Script Editor.
- Load the Divide_Scope Python Script.
Note: The script name can change according to the new version released. The latest script is: DivideScope RevE (3_4).py.
- Browse the folder on which the file has been saved.
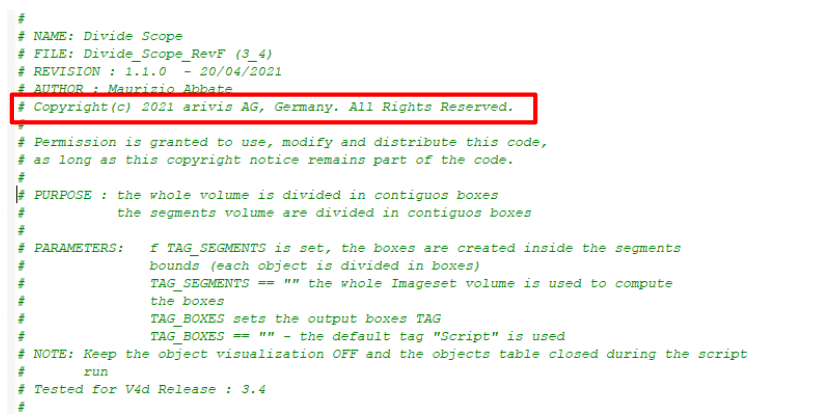
Python script code usage rights:The user has the permission to use, modify and distribute this code, as long as this copyright notice remains part of the code itself: Copyright(c) 2021 arivis AG, Germany. All Rights Reserved.
Setting the script features
In order to define the contiguous sub-regions (sampling volume) features, few parameters of the script should be adjusted to match your analysis needs. These parameters are located in the code area labeled as USER SETTING.
Only the parameters located in the USER SETTING area can be modified. Don’t change any other number, definition or text in the code outside this dedicated area.
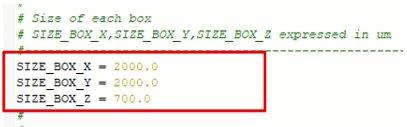
SIZE_BOX_X= the X axis size of each box . The value is expressed in µm.SIZE_BOX_Y= the Y axis size of each box . The value is expressed in µm.SIZE_BOX_Z= the Z axis size of each box . The value is expressed in µm.
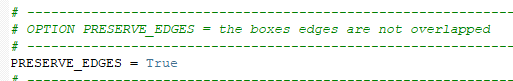
PRESERVE_EDGES= This option sets the boxes touching / non touching feature. IfTRUE, the boxes edges are not contiguous to each other (2 pixels space in between).
Note: The volume sizes (XYZ) are divided by the single box XYZ size. The integer number of boxes fitting in the volume is computed. It may happen that the boxes don't cover the whole sample volume.
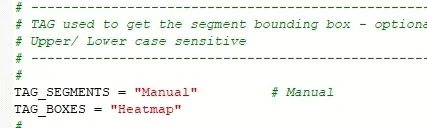
TAG_SEGMENTS= defines the segments TAG to be used to compute the boxes. It is used as alternative of the standard method (whole volume). If empty, the default method (whole volume) is used.
TAG_BOXES= defines the TAG assigned to the created boxes.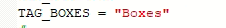
TAG_SEGMENTS = “”
TAG_SEGMENTS = “Manual”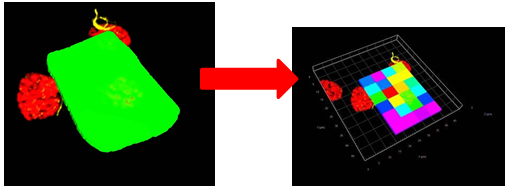
Note: If theTAG_SEGMENTSis set to an existing TAG, all the objects belonging to it are used to create the boxes matrix. Specifically, the bounding box volume of each object is taken as the reference volume that is divided into boxes.
Running the Python script
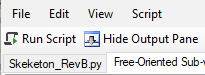
Run the Free-Oriented Sub-volume Python Script by pressing the Run Script button or pressing the F5 key.
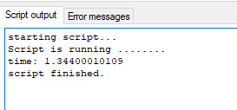
Note: Activate the Output Panel, if not already displayed. The status of the script execution (errors including) will be visualized here.