Setting opacity in 3D renderings
This guide explains how to perform an optimal opacity setting according to the active rendering modality.
Making the biological structures transparent, digitally acquired inside their complex world, allows us to see through the objects in the foreground. The contribution of the voxels in front of you, referring to your point of view (camera view), is reduced compared to their real intensity value. The reduction of intensity is obtained by editing the opacity coefficient accordingly to our visualization needs.
This operation is defined as the single voxel's intensity values mapping vs. the opacity coefficient. However, this allows only a limited selection of the structures in the dataset, like specific structures or anatomical regions, since no spatial or specific information is considered. Since the structures do not just differ by intensity values, opacity is not suited for the selection or identification of objects in a dataset but only to improve visibility.
See also
Basic concepts
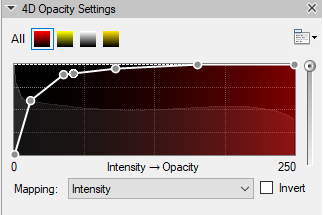
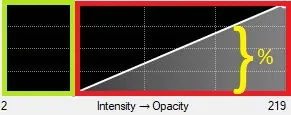
The Opacity gradient curve is set graphically.
The intensity range is located on the abscissa axis while the Opacity percentage is represented on the ordinate axis.
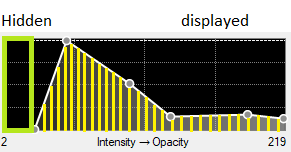
All the voxels having an intensity value located inside the curve, give them a contribute proportionally to the Opacity percentage set. The rest of the voxels, located outside the curve, are not visualised.
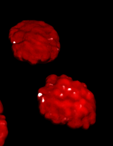
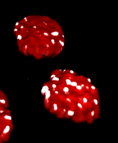
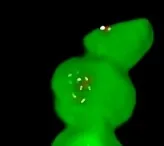
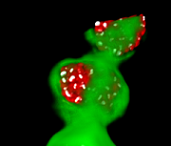
Below you can see two examples of different levels of opacity on the green channel. High opacity level on the left, low opacity level on the right.
Setting the opacity
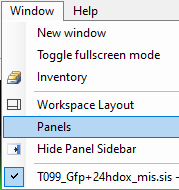
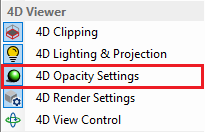
- Open the 4D Opacity Setting panel through Window > Panel menu.
- The channel selector is located on the top left corner of the panel.
The Opacity curve graph is displayed in the center.
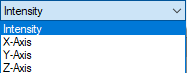
The Mapping option allows to map the opacity vs the active channel intensity (default).
The Mapping can be inverted using the Invert checkbox.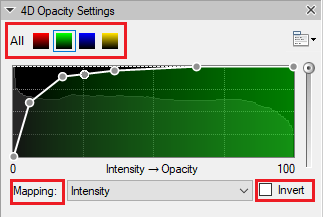
- As an alternative, the opacity can be mapped by the distance from the origin of one of the axes (X, Y or Z).
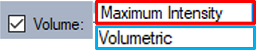
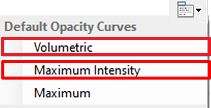
- Set the default Opacity curve according to the active rendering mode.
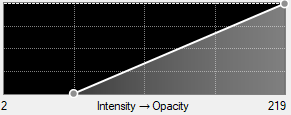
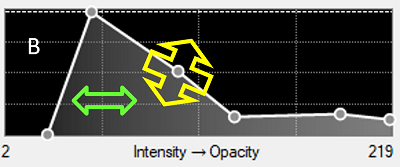
- Change the shape of the Opacity curve by acting on it. Left-click on the line to add a new point.
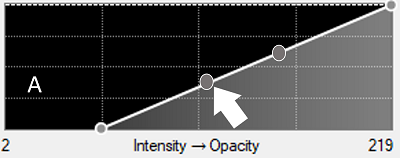
- Drag the points to change the shape of the curve. Move the curve to the left or the right to position it within the dynamic range.
- (Optional) Save the Opacity curve as a preset.

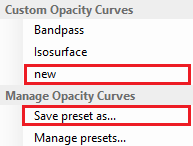
- The new preset will be shown in the pop-up menu in the Manage Opacity Curves section.