Creating freely XY oriented sub volumes
This guide explains how to create a sampling volume (ROI) freely oriented along X and Y axis.
The application uses a Python script to create single or contiguous sub-regions that can be used as ROI for further analysis.
See also
Opening the working dataset
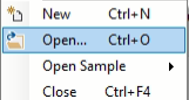
- Select Open... from the file menu.
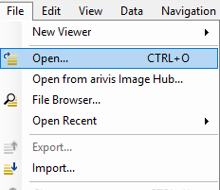
- Select the dataset from the file browser.
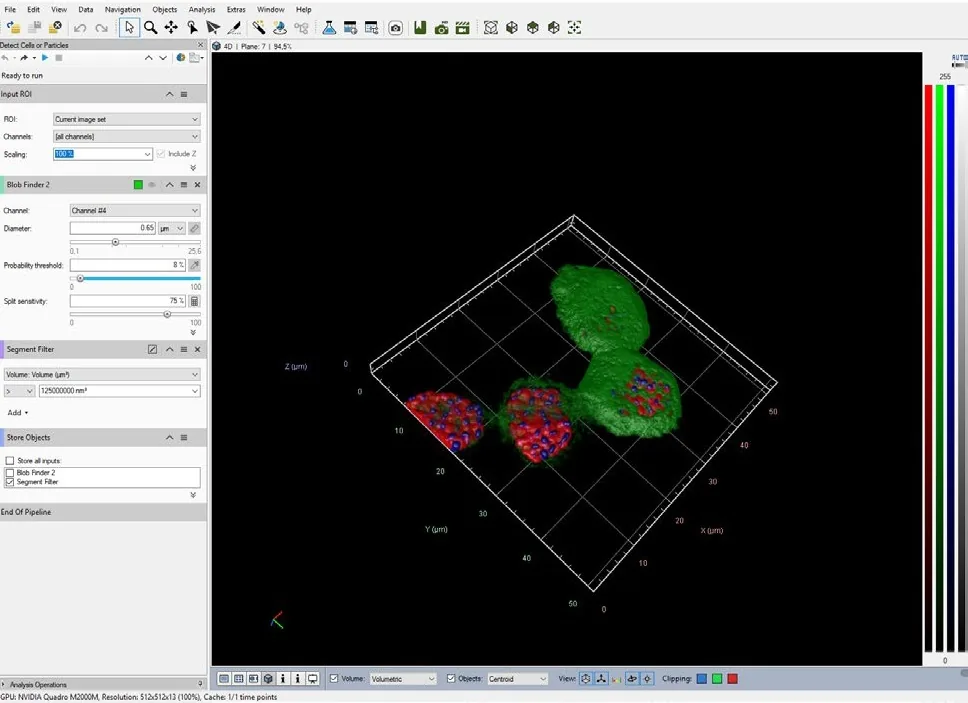
The dataset is a multi dimensional, discrete, representation of your real sample volume. It can be structured as a Z series of planes (Optical sectioning) of multiple channels (dyes) in a temporal sequence of time points (located in several spatial positions).
Usually, the dataset shows a single experimental situation (a complete experiment can be composed by several datasets). The datasets are available as graphic files saved in plenty of file formats (standard formats as well as proprietary formats).
Note: The dataset is visualized according to the current rendering setting parameters. Refer to the arivis Pro Help for more details.
Drawing the reference ROI
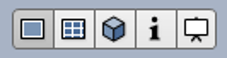
- Switch the Viewing area from 4D to 2D view mode.
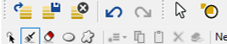
- Select the Draw Objects tool.
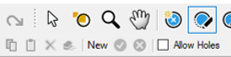
- Select the Brush tool.
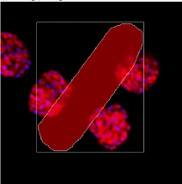
- Draw the 2D ROI over any Z plane. Use the Erase Brush to correct the ROI if necessary.

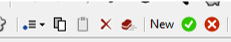
- Press the green icon to confirm the ROI.
The TAG Manual is now available in the data table.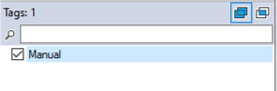
Loading the Python script
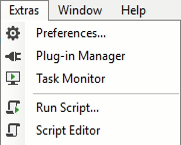
- Open Python Script Editor. From the Extra menu, select Script Editor.
- Load the Free-Oriented Sub-volume Python Script.
- Browse the folder on which the file has been saved.
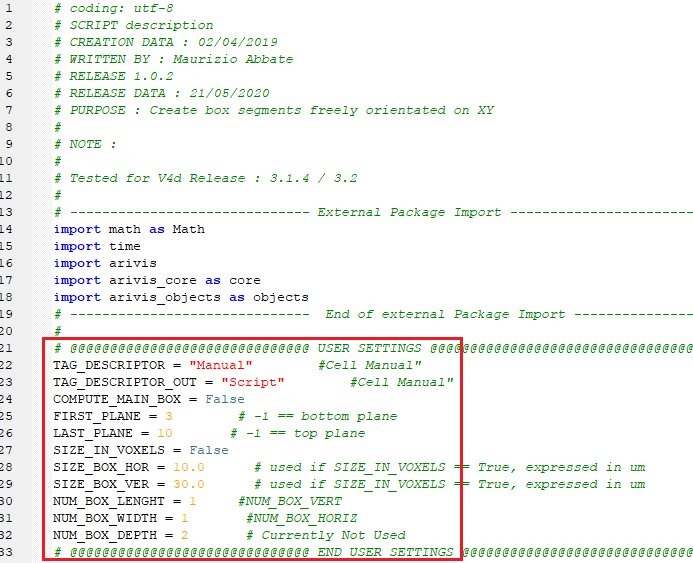
Only the parameters located in the USER SETTING area can be modified. Don’t change any other number, definition or text in the code outside this dedicated area.
Setting the script features
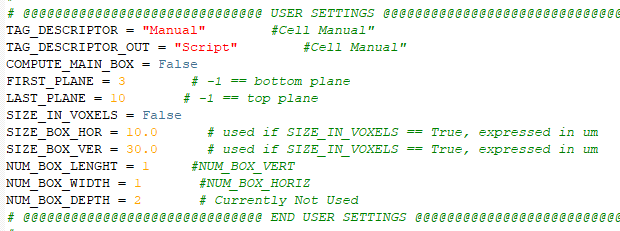
To define the contiguous sub-regions (sampling volume) features, few parameters of the script should be adjusted to match your analysis needs. These parameters are located in the code area labeled as USER SETTING.
- Set the Z planes range.
FIRST_PLANE defines the lower Z plane of the sub-regions ROI.
LAST_PLANE defines the higher Z plane of the sub-regions ROI.
The values of -1 set the Z planes range equal to the whole volume depth (total number of Z Planes available).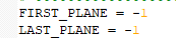
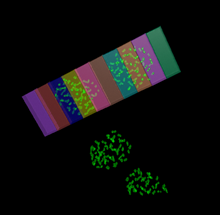
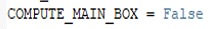
- COMPUTE_MAIN_BOX = True enables the creation of an additional ROI having the same sizes of the total subregions ROI size.
- NUM_BOX_LENGHT defines the number of sub-regions along the main axis (the longest one). NUM_BOX_WIDTH defines the number of sub-regions along the minor axis (the shortest one).
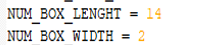
Note: Set the number of sub-regions accordingly to the total size of the reference ROI. Don’t create boxes too small.
Examples:
NUM_BOX_LENGHT = 10
NUM_BOX_WIDTH = 1
NUM_BOX_LENGHT = 10
NUM_BOX_WIDTH = 2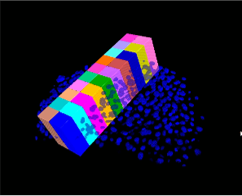
SIZE_IN_VOXELSdefines if the size of the Sub-Volume is expressed in metric unit (True) or it is calculated from the reference ROI size (False).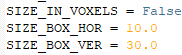
SIZE_BOX_HORandSIZE_BOX_VERdefines the Sub-Volume XY size in microns. The sizes are referred to a single box.SIZE_IN_VOXELSmust beTrueto create the box in microns.
Note:NUM_BOX_LENGHTandNUM_BOX_WIDTHare also involved in the metric Sub- Volume creation.
Examples:SIZE_IN_VOXELS = TrueNUM_BOX_LENGHT = 1NUM_BOX_WIDTH = 1SIZE_BOX_HOR = 10 (microns)SIZE_BOX_VER = 30 (microns)
SIZE_IN_VOXELS = TrueNUM_BOX_LENGHT = 3NUM_BOX_WIDTH = 2SIZE_BOX_HOR = 5 (microns)SIZE_BOX_VER = 10 (microns)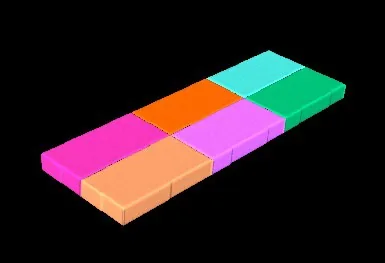
Running the Python script
Run the Free-Oriented Sub-volume Python Script by pressing the Run Script button or pressing the F5 key.
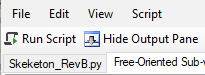
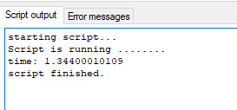
Note: Activate the Output Panel, if not already displayed. The status of the script execution (errors including) will be visualized here.