ZEISS Microscopy Knowledge Base
Help
ZEISS Microscopy Knowledge Base
Search
Detecting dendritic spines (Probability Map)
Introduction
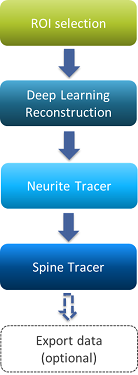
The guide explains you how to trace dendritic spines using the Spine Tracer operation included in the Tracing module. The operation provides 3 methods (AI-assisted, Use Segments and Use Probability Map) to detect and connect dendritic spines to an already existing trace. This guide focuses on the probability map method.
Workflow
Activating the Sample Pipeline
- In the Shortcut Toolbar, click Analysis Panel
 .
. 
- In the Sample Pipelines list, double-click the Detect Spines with Use Probability Map Method pipeline.
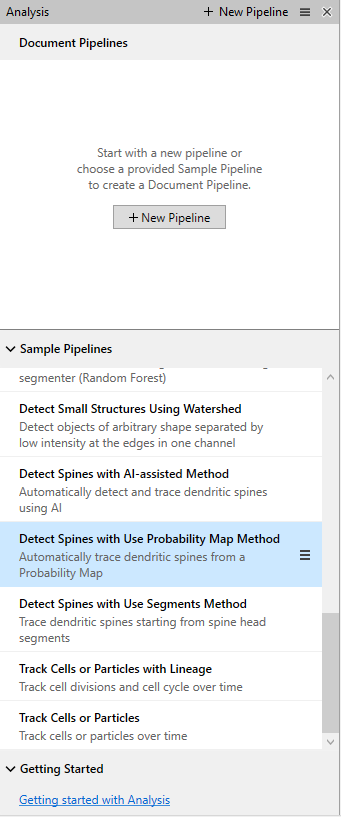
- If you have activated a pipeline, it will be replaced by the new one.
You can open the appropriate How-to guide. By hovering over a pipeline, this button  is displayed. When clicking on it, the option Open How to appears.
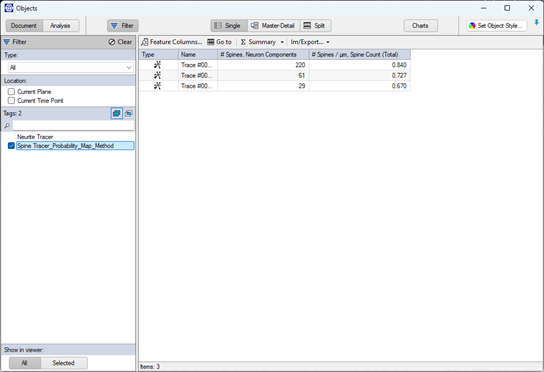
Viewing the results
- If not already visible, open the Objects dialog. In Shortcut Toolbar, click Objects table
 .
. - Measurements are now visible in the objects table.
- To color the results more meaningfully, click Set Object Style.
- Click Apply to: Traces.

- To select the trace color options, select one item from the Color by list.
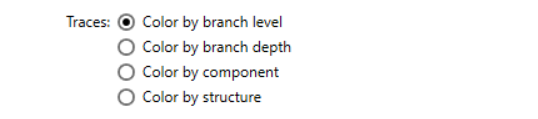
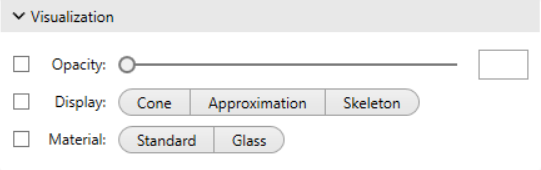
- To set further style settings, set the parameters in the Visualization section.
Refer to the Help (F1) for more Information.