ZEISS Microscopy Knowledge Base
Help
ZEISS Microscopy Knowledge Base
Search
Detecting dendritic spines (AI-assisted)
Introduction
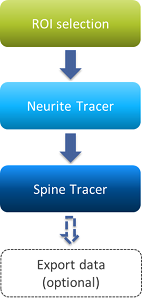
The guide explains you how to trace dendritic spines using the Spine Tracer operation included in the Tracing module. The operation provides 3 methods (AI-assisted, Use Segments and Use Probability Map) to detect and connect dendritic spines to an already existing trace. This guide focuses on the AI-assisted method.
Workflow
Activating the Sample Pipeline
- In the Shortcut Toolbar, click Analysis Panel
 .
. 
- In the Sample Pipelines list, double-click the Detect Spines with AI assisted Method pipeline.
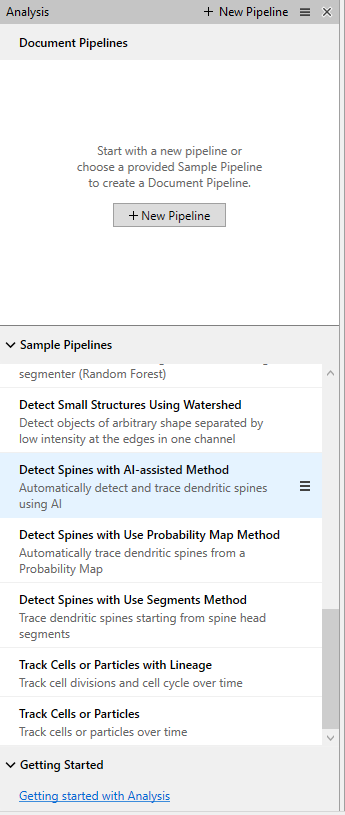
- If you have activated a pipeline, it will be replaced by the new one.
You can open the appropriate How-to guide. By hovering over a pipeline, this button  is displayed. When clicking on it, the option Open How to appears.
Viewing the results
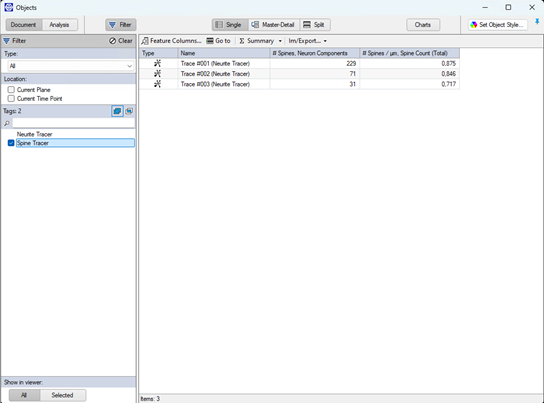
- If not already visible, open the Objects dialog. In Shortcut Toolbar, click Objects table
 .
. - Measurements are now visible in the objects table.
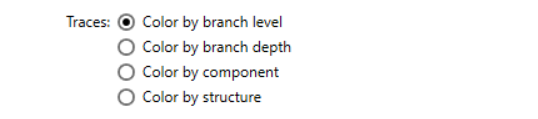
- To color the results more meaningfully, click Set Object Style.
- Click Apply to: Traces.

- To select the trace color options, select one item from the Color by list.
- To set further style settings, set the parameters in the Visualization section.
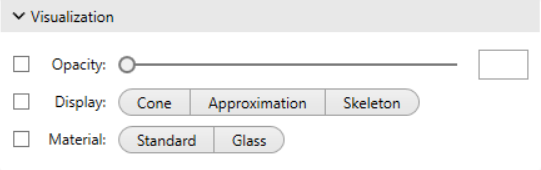
Refer to the Help (F1) for more Information.