Image Analysis
This module enables you to create automatic measurement routines very easily. The Image Analysis wizard guides you through the steps to create an automatic measurement program. It allows you to set up even complex measurement tasks easily. The steps of the wizard include image segmentation, object separation and measurement of geometrical or intensity features. After you have completed the setup, you can apply these settings to the data to be analyzed and obtain precise measurement results. You can display the results in table and list form and export them to csv-format.
For more information, see the following examples:
- Measuring Fluorescence Intensity in a Multichannel Image
- Counting Number of Fluorescence Signals per Nuclei
- Measuring Mean Fluorescence Intensity on a Ring around the Primary Object
- Counting the Number of Objects in a Ring around the Nucleus
See also the following descriptions:
Creating a New Image Analysis Setting
When creating a new analysis setting for your images, you can select the following segmentation methods:
- Segment Region Classes Independently: This method allows you to define several classes and subclasses. With this method, you can define the segmentation algorithm for each class independently.
- ZOI (Zones of Influence): This method constructs a zone of influence (ZOIs) and a ring around each primary object. The primary objects are generated by segmenting the selected image channel with the selected class segmenter. The ring is defined by its width and distance from the primary object. The distance from the ZOI border from the ring can be specified. The ZOI area also incorporates the primary object and ring area.
- On the Analysis tab, in the Image Analysis tool, click
 and select New from the dropdown.
 - In the Settings field, enter a name for your image analysis setting and click Save.
- A new *.czias file is created and saved in the ...\ZEN\Documents\Image Analysis Settings folder.
- You have created a new image analysis setting. As default the method Segment region classes independently is used.
- For Method, click
 .
. - The Segmentation Method Selection dialog opens.
- From the Method drop down menu, select a method and click OK.
- You have created a new image analysis setting using the method of your choice.
- In the Image Analysis tool, click Edit Image Analysis Setting.
- The Image Analysis Wizard opens with the Classes step and includes already a predefined set of classes, depending on the selected method. Follow the steps in the wizard to define your image analysis. Each method comes with a predefined set of steps which allows you to make all necessary settings for image analysis.
- Classes: Allows you to add classes and subclasses.
- Frame: Allows you to define a measurement frame. Only the area of the frame will be analyzed.
- Region Filter: Allows you to define simple or complex conditions to filter the detected objects according to their parameters.
- Automatic Segmentation: Allows you to set the parameters for the automatic segmentation.
- Interactive Segmentation: Allows you to modify the results of the automatic segmentation or draw/delete objects. Note: this step only generates relevant results in Start Interactive Analysis run.
- Features: Allows you to select measurement features from an extensive list and to define measurement features for classes and subclasses independently.
- Statistics: Allows you to define custom statistical features for your regions or objects.
- Results Preview: Shows a preview of your measurement results for the current view port.
For more information, see the following examples:
Creating a Measurement Data Table
- Click on the Create Measurement Data Table button on the Analysis tab.
- The two data lists are now separate documents.
- Save each of the data lists via the File menu > Save As. Allocate a name and select .csv as the file type.
- The measurement data tables are saved in CSV format and can therefore be opened directly in Excel.
- Click on the image and save it via the File menu > Save As. Allocate a name and select .czi as the file type.
- The image is saved with the measurement results. If you open the image, the measurement results can be viewed in the Analysis View.
Creating an Image Analysis Setting from an Analyzed Image
It is possible to create or extract an image analysis setting from an image which has already been analyzed. This allows you to ensure that a new data set is analyzed exactly in the same way as a previously analyzed data set.
- You have an already analyzed image.
- Open your already analyzed image in ZEN.
- On the Analysis tab, in the Image Analysis tool, click on Options
 .
. - In the drop-down list, select Create setting from analyzed image.
- Type in the name you want to give the analysis setting.
- Press Enter on your keyboard or click on
 .
.
- You have now created and saved an image analysis setting from an already analyzed image.
Performing an Interactive Analysis
The Image Analysis tool allows you to perform an analysis interactively. It runs the selected analysis setting with all the steps that have been marked as interactive in the setup. Steps that you have not marked as interactive in the Image Analysis Wizard are run with the values predefined in the image analysis setting. The setting does not pause to allow you to change these values interactively.
Start Interactive Analysis also allows you to directly execute an image analysis on a czi image without predefining an image analysis setting. For that you need to have an image analysis setting where all steps are marked as interactive. Then it is possible to modify every step of the Image Analysis Wizard during the interactive analysis and do a one-time image analysis on the dataset without creating a new setting. In order to retrieve an image analysis setting from an already analyzed dataset, see Creating an Image Analysis Setting from an Analyzed Image.
Note: When you analyze an image interactively, the modifications of the settings during the interactive analysis are not saved.
- You have defined an image analysis setting where all analysis steps you want to adjust interactively are marked as interactive.
- On the Analysis tab, open the Image Analysis tool.
- For Setting, select your image analysis setting.
- Click on Start Interactive Analysis.
- The Image Analysis Wizard opens with all the steps that are defined as interactive in the setting.
- Modify your settings for each step and click Next to get to the following step in the wizard.
- At the end, click Finish to close the wizard.
- You have now analyzed your image interactively and the results of this analysis are displayed.
Creating Custom Features
- You are in the Features step of the image analysis wizard.
- Select a class in the list and click Custom Feature.
- The Custom Feature Editor opens. All already defined features are displayed in the list, or on initial opening an empty default entry is already created.
- In the Custom Features list, click
 to add a new entry. Alternatively, if no feature has been defined yet, select the automatically displayed default entry.
 - A new entry is added to the list.
- Under Define Custom Feature, define the Name for your feature and optionally specify a Unit, if applicable.
- In the Define Operands list, click to add a new operand. Alternatively, if no feature has been defined yet, select the automatically displayed default entry
- A new operand entry is created.
- Select the Class which is used to generate the operand.
- In the Features dropdown list, select the measurement feature that you want to use to define the operand.
- The selected class and measurement feature are displayed as Expression.
- Repeat the previous steps to define all operands you need to calculate your custom feature.
- All defined operands are displayed in the Define Operands list.
- Under Define Custom Expression, enter your operands and use the mathematical operators to define the calculation for your custom feature, e.g. 100*(a/b+Math.Pow(c,2)).
- Click Verify Expression.
- The syntax of your expression is checked and verified. In case the expression is not valid, an error message is displayed.
- Repeat this whole workflow to create all custom features required for your image analysis.
- All created features are displayed in the Custom Features list of the respective class.
- Click OK.
- The editor closes and saves the defined custom features. They are displayed in the list of the Features step of the wizard.
- After analyzing an image with the setting, the custom features are displayed in the result table of the respective class and are also available for the charts in the Analysis view, just as for any other features.
See also
Creating Custom Statistical Features
- You are in the Statistics step of the image analysis wizard.
- Select a class in the list and click Define Custom Feature.
- The Custom Statistic Feature Editor opens. All already defined features are displayed in the list, or on initial opening an empty default entry is already created.
- In the Custom Features list, click to add a new entry. Alternatively, if no feature has been defined yet, select the automatically displayed default entry.
- A new entry is added to the list.
- Under Define Custom Feature, define the Name for your feature and optionally specify a Unit, if applicable.
- In the Define Operands list, click to add a new operand. Alternatively, if no feature has been defined yet, select the automatically displayed default entry
- A new operand entry is created.
- Select the Class which is used to generate the operand.
- In the Features dropdown list, select the measurement feature that you want to use to define the operand.
- Select the Statistical Operation the operand is used for.
- The selected class and measurement feature are displayed as Expression.
- Repeat the previous steps to define all operands you need to calculate your custom statistical feature.
- All defined operands are displayed in the Define Operands list.
- Under Define Custom Expression, enter your operands and click on the mathematical operators to define the calculation for your custom statistical feature, e.g.
100*(a/b+Math.Pow(c,2)). - Click Verify Expression.
- The syntax of your expression is checked and verified. In case the expression is not valid, an error message is displayed.
- Repeat this whole workflow to create all custom statistical features required for the image analysis.
- All created features are displayed in the Custom Features list of the respective class.
- Click OK.
- The editor closes and saves the defined custom features. They are displayed in the list of the Statistics step of the analysis wizard.
See also
Creating an Image Analysis Setting From an AI Model
Once you have downloaded an AI model, you can use it for image analysis by creating an image analysis setting.
- You have downloaded or imported an AI model trained on one or multiple channels, see Downloading AI Models or Importing AI Models.
- On the Applications tab, open the AI Model Store tool and click Open AI Model Store. Alternatively, click for a model in the Available Models list and select Create Analysis Setting.
- The AI Model Store dialog opens to display all available AI models.
- Select the model in the list.
- The Properties section on the right displays more detailed information about your selected model.
- In the Properties section, click Create Analysis Setting.
- A file browser opens.
- Enter a name for the setting and click Save.
- The setting is saved as *.czias file in the respective folder.
- You can now use the setting for image analysis in ZEN and select it in the Image Analysis tool. Note that some parameters are pre-defined in this setting based on the model and cannot be changed, e.g. the number of classes and the segmentation method. If you need to create a more complex hierarchy level of classes (e.g. define sub-classes or Zone-of influence), set up an ordinary image analysis setting. In the Automatic Segmentation step of the setup, you can then select models trained on single channel images for the segmentation of the individual classes.
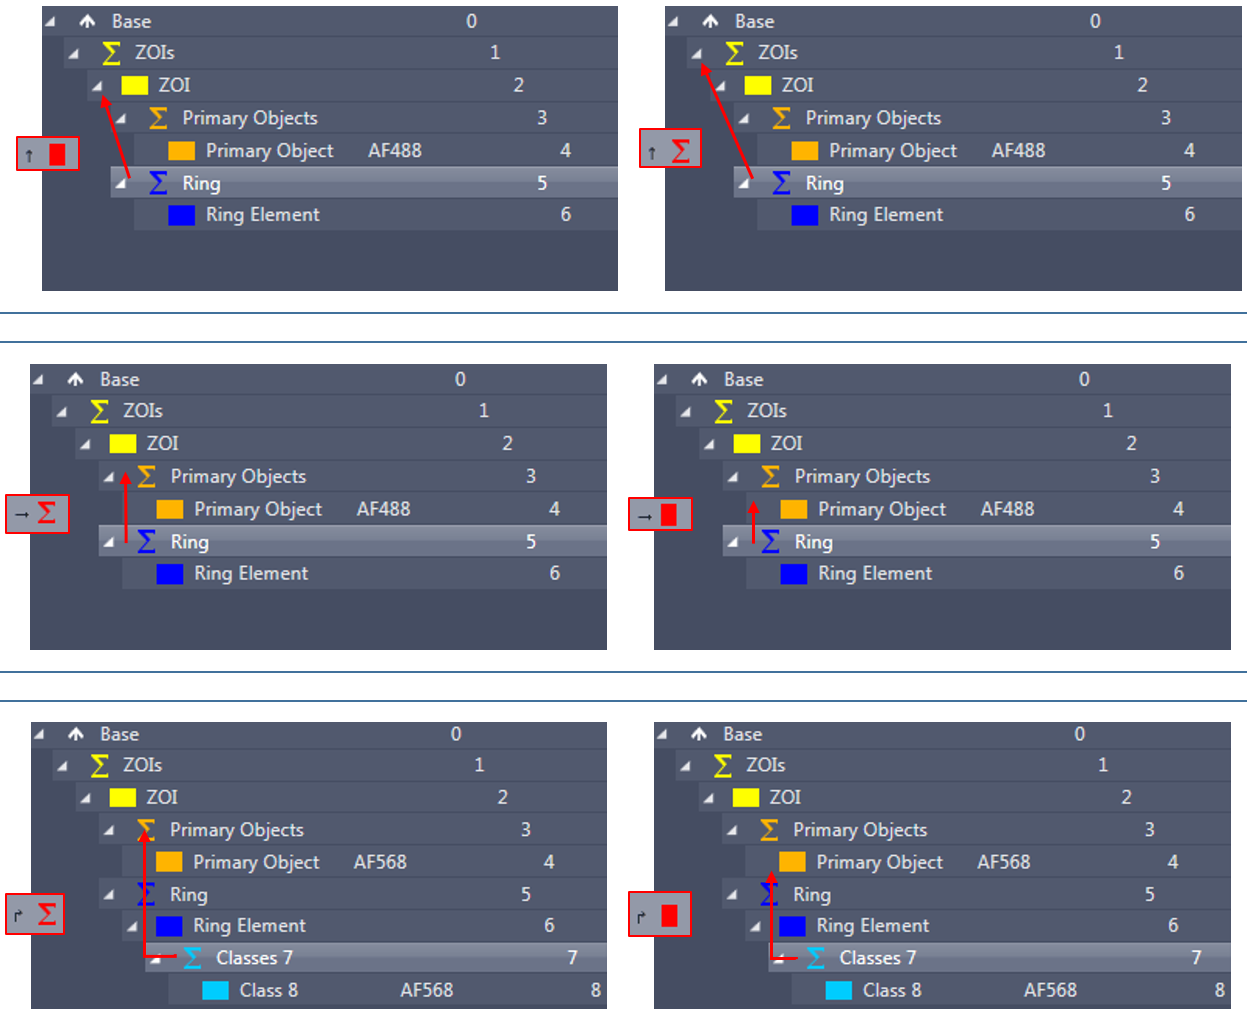
Copy Operations for Features
In the feature selection dialogs for individual or all regions, you can define where a selected feature is copied to. The following copy operations are available:
 Copies the selected feature also in the result table of CLASSES in the next higher hierarchy level.
 Copies the selected feature also in the data table of CLASS in the next higher hierarchy level.
 Copies the selected feature also to the data table of the first CLASSES element of the same hierarchy level.
 Copies the selected feature also to the data table of the first CLASS element of the same hierarchy level.
 Copies the selected feature also in the data table of the first CLASSES element on the next higher hierarchy level.
 Copies the selected feature also in the data table of the first CLASS element on the next higher hierarchy level.
ON THIS PAGE
- Image Analysis
- Creating a New Image Analysis Setting
- Creating a Measurement Data Table
- Creating an Image Analysis Setting from an Analyzed Image
- Performing an Interactive Analysis
- Creating Custom Features
- Creating Custom Statistical Features
- Creating an Image Analysis Setting From an AI Model
- Copy Operations for Features