Image Analysis Wizard
This wizard guides you through the setup of an image analysis. It is only available if you have licensed functionality for Image Analysis or 3D Image Analysis. Note that some of the parameters differ depending on whether you set up a 2D or a 3D analysis.
The following basic controls enable you to move through the steps:
|
Parameter |
Description |
|---|---|
|
Next |
Moves on to the next step of the wizard. |
|
Back |
Moves back to the previous step of the wizard. |
|
Cancel |
Cancels the wizard. No changes are applied to your settings. |
|
Finish |
Saves the setup and the changes based on your progress and closes the wizard. |
Classes
In this step you can define the classes into which the measured objects in the image are divided.
|
Parameter |
Description |
|
|---|---|---|
|
Interactive |
Activated: The class definition can be changed interactively while the analysis setting is run with Start Interactive Analysis. |
|
|
Class List |
Displays the defined classes. If you create a new analysis setting, a predefined set of classes is created automatically. The classes list differs if you have a 3D analysis setting. For a 2D analysis, each class consists of two entries. The first entry concerns the entirety of all objects belonging to the class. The second entry represents the individual objects. |
|
|
Add Class |
Adds a new individual class to the list on the base level. |
|
|
Add Subclass |
Adds a new subclass to the selected class. |
|
|
Remove Class |
Deletes the selected class from the list. |
|
|
Name |
Defines the name for the selected class in the list. |
|
|
Channel |
Selects the channel that is used for image segmentation of the selected class in the Classes list. |
|
|
Color |
Selects the color to mark the objects of a class. |
|
|
Object Color |
Only visible if you have selected a class entry for individual object. |
|
|
– |
Random |
The objects found by the analysis will be colorized randomly. |
|
– |
Fixed |
Selects the fixed color to mark the objects of a class. |
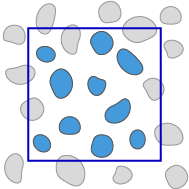
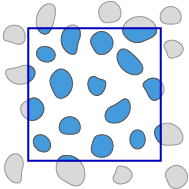
Frame
In this step you can define one or more measurement frames. Only the area within the measurement frames gets analyzed. You can also define how the analysis treats objects that are cut by the border of the image or the frame.
|
Parameter |
Description |
|
|---|---|---|
|
Interactive |
Activated: The measurement frame definition can be changed interactively while the analysis setting is run with Start Interactive Analysis. |
|
|
|
Enables you to select already created measurement frames. To select a measurement frame, click inside it. To select several measurement frames, press the Ctrl key and click inside the desired measurement frames. Once you have selected a measurement frame, you can change its size. |
|
|
|
Enables you to create a rectangle as a measurement frame in the current image. |
|
|
|
Enables you to create a circle as a measurement frame in the current image. |
|
|
|
Enables you to create a contour as a measurement frame in the current image. |
|
|
|
Removes all drawn-in measurement frames in the current image. To delete single frames, select them and press Del. |
|
|
Maximize Circle |
Only available for 2D settings and only active if you have defined precisely one circle. Activated: Maximizes the drawn-in circle to the full image size. In the case of rectangular images the circle is adjusted to the shorter side. |
|
|
Center Circle |
Only available for 2D settings and only active if you have defined precisely one circle. Activated: Centers the drawn-in circle to the full images size. |
|
|
Mode |
Selects how the measurement frame should be applied. Note that this behavior is only applied when running the analysis (interactively) and not during the setup. The setup always uses the Cut at Frame mode. The following modes are available: |
|
|
- |
Inside Only |
Measures only those objects, that are lying completely within the measurement frame. Objects that are touching the frame or are intersected by the frame are not analyzed.
|
|
- |
Cut at Frame |
Measures all objects that are lying within the measurement frame. Objects that are intersected by the measurement frame are measured precisely up to the measurement frame.
|
|
The following fields are only active if you have selected a drawn-in graphic element: |
||
|
Left |
Sets the starting point for the frame on the X axis in pixels. |
|
|
Top |
Sets the starting point for the frame on the Y axis in pixels. |
|
|
Width |
Sets the width of the frame in pixels. |
|
|
Height |
Sets the height of the frame in pixels. |
|
|
Color |
Selects the color of the frame. |
|
|
Show Frame On Analyzed Image |
Activated: Displays the frame on the image after the analysis has run. |
|


Results Preview
In this step you see a preview of the measurement result. The results table contains only the measurements performed in the current view port. These results may differ from the actual results when the complete image analysis is performed. This increases the performance during the setup.
The results in the table depend on the settings you made in the Feature step. The table contains all selected features for the highlighted class/classes. Click on a row of the table to highlight the corresponding object in the image or vice versa.
The measured image is displayed in the Analysis View.
|
Parameter |
Description |
|
|---|---|---|
|
Classes |
Here you can select the class for which you want to see the measured features. |
|
|
Highlight Box |
||
|
- |
Color |
Allows you to set the color of the highlight box surrounding the selected object in the image. |
|
- |
Line Width |
Allows you to set the line width of the highlight box around the selected object in the image. |
|
Enable Chart |
Only visible for 2D image analysis settings. Activated: Displays a chart with measurement results in the Analysis View by default. |
|
|
Chart Type |
Only visible for 2D image analysis settings. Sets the default chart type that will be displayed in the Analysis View. With the two buttons, you can either select the Scatter Chart or the Histogram Chart as default. |
|
|
X-Axis |
Only visible for 2D image analysis settings. Selects the default feature that is displayed on the x-axis of the chart in the Analysis View. |
|
|
Y-Axis |
Only visible for 2D image analysis settings and only available for the scatter chart. Selects the default feature that is displayed on the y-axis of the chart in the Analysis View. |
|
|
Multiple Scenes |
Only visible for 2D image analysis settings and only available for multi-scene images. Activated: Sets as the default chart a histogram/ scatter chart that contains the data points of all scenes. |
|
|
Time Series |
Only visible for 2D image analysis settings and only available for time series images. |
|
|
Heatmap |
Only visible for 2D image analysis settings and only available for experiments with multi well/ multi chamber plates (multiple scenes). |
|
|
Back |
Moves back to the previous step of the wizard. |
|
|
Finish |
Saves the created analysis setting and ends the wizard. |
|
|
Cancel |
Cancels the analysis setting and closes the wizard. |
|