Measuring Mean Fluorescence Intensity on a Ring around the Primary Object
The following example shows how to use the Zone of Influence (ZOI) method to measure intensities within a ring that is associated to the main object, e.g. the cell nucleus. An application example are transport assays where the intensities of a certain fluorescent marker in the cytoplasm are compared to the intensities within the nucleus.
In this example we use a multichannel image of fluorescence-stained cells. The cell nuclei are stained with AF568 and the mitochondria are stained with AF488. First, we detect the nuclei in the AF568-channel as primary object. A zone of influence is generated around each detected primary object. In this area, we can define a ring and specify its thickness and distance from the main object. You can use this ring to measure intensities or to detect further sub-objects on it. For more information, see Counting the Number of Objects in a Ring around the Nucleus.
See also
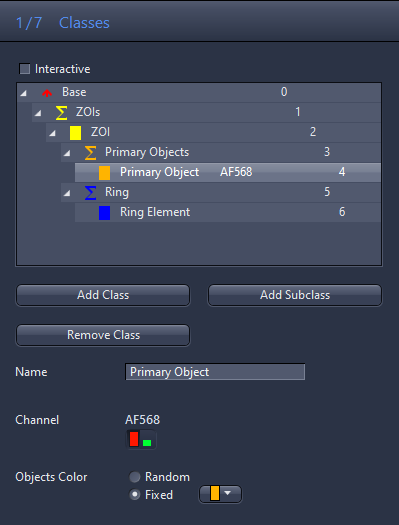
Step 1: Classes
- You have set up the image analysis setting with the method ZOI (Zones of Influence) and have opened the Image Analysis Wizard, see Creating a New Image Analysis Setting. This has created the classes ZOIs/ZOI, Primary Objects/Primary Object, and Rings/Ring by default.
- If you want to extend the predefined list of classes, click Add Subclass in the Classes step.
- You can find an example how to detect objects on the ring in Counting the Number of Objects in a Ring around the Nucleus.
- If necessary, click Add Class to extend the predefined list by another independent class of objects.
Note that you cannot add further rings. - Select the image channel which you want to use for object detection. In this example, the primary objects (the nuclei) are in the AF568 channel. Therefore, click on the class Primary Object and select the channel containing the nuclei.
|
Parameter |
Description |
|---|---|
|
ZOIs |
Class of all zones of influences. |
|
ZOI |
Individual zone of influence. |
|
Primary Objects |
Class of all primary objects. |
|
Primary Object |
Individual primary object. |
|
Ring |
Individual ring. |
|
Ring Segment |
Part of a ring (a ring often consists of only one ring segment). |
Step 2: Frame
Optionally, you can define the area to be analyzed of each image. In case there are shading effects or other reasons that make you want to include only a certain area of each image for analysis, you can define a frame (rectangle, circle or polygon). Only the area within this frame will be further analyzed.
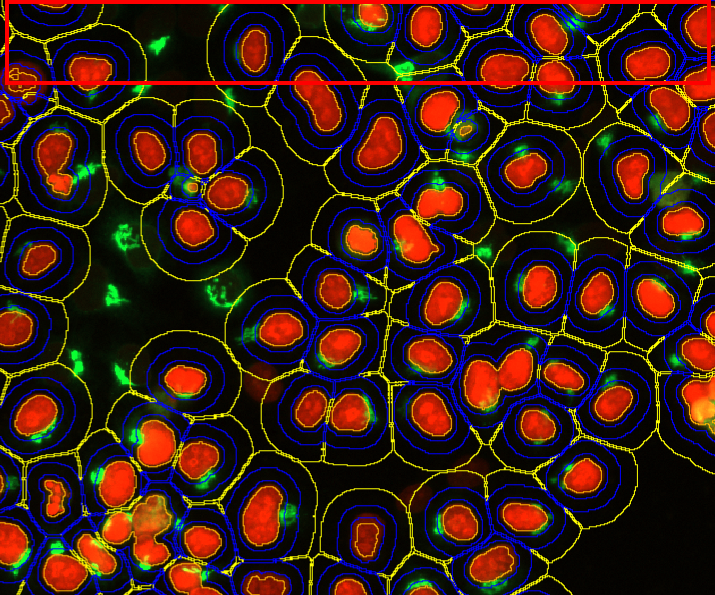
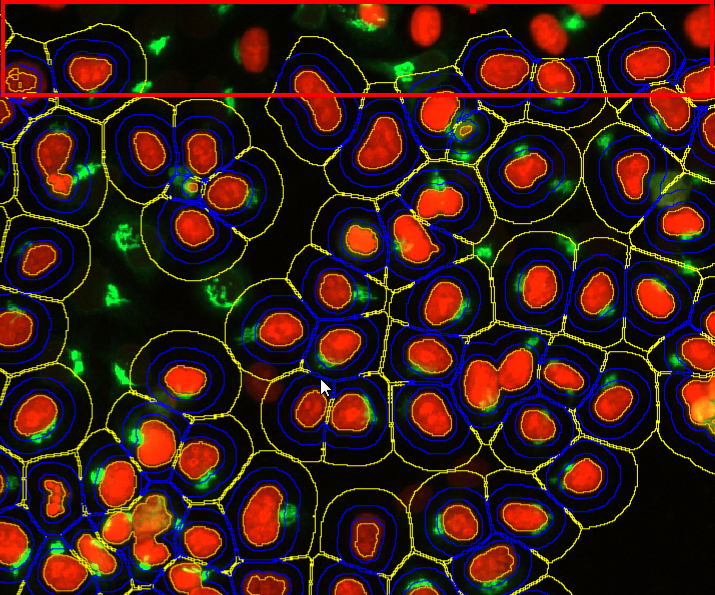
With the Mode parameter, you can furthermore choose how the analysis treats objects that are cut by the border of the image or the frame:
- Cut at frame: Cuts the objects at the frame.
- Inside only: Discards all objects that are cut by the frame.
Note that the whole ZOI is taken into account for the decision if the object is inside the frame or not (not only the primary object). This means there are cases where the primary object might lie completely within the image/frame, but the Ring or ZOI is cut by the border. If you select Inside only, these objects will be discarded.
Comparison of image analysis results for Cut at frame compared to Inside only:
Step 3: Automatic Segmentation
- Select Primary Object and set up suitable parameters to detect the objects, i.e. threshold, area, separation.
- As soon as objects are detected, the ZOI and Ring are automatically created around each primary object with the preset parameters.
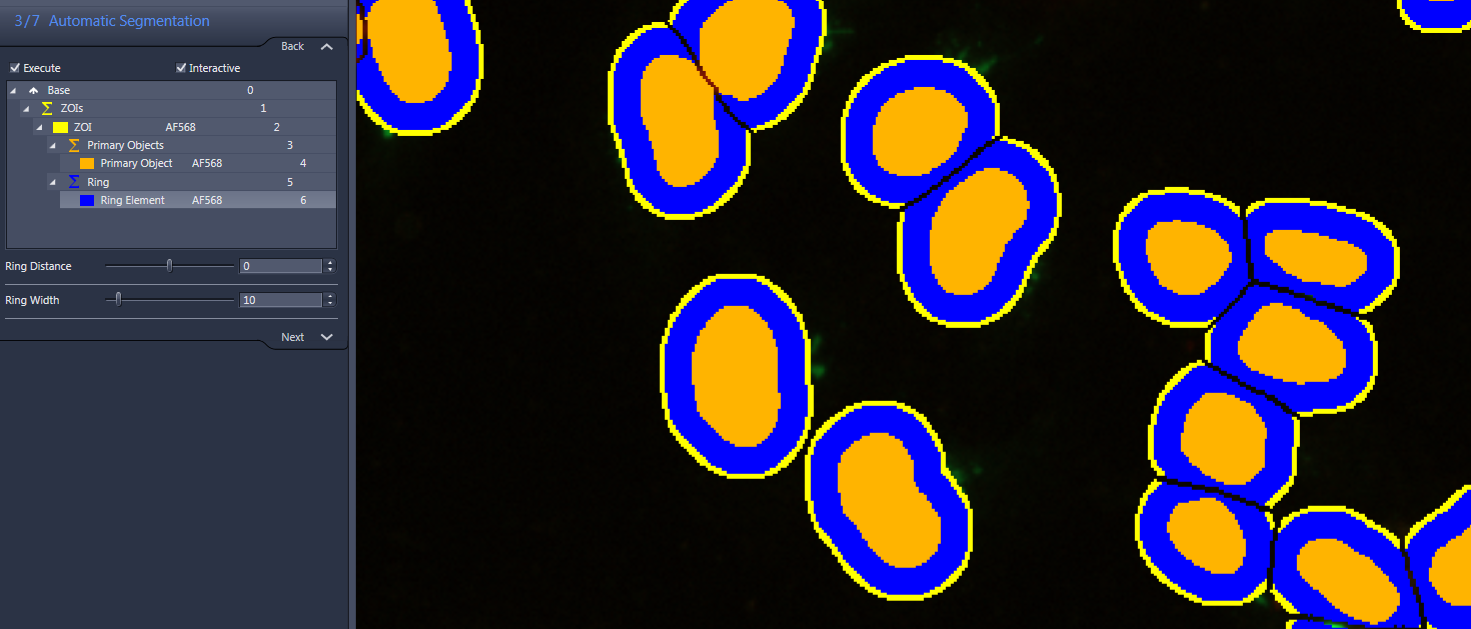
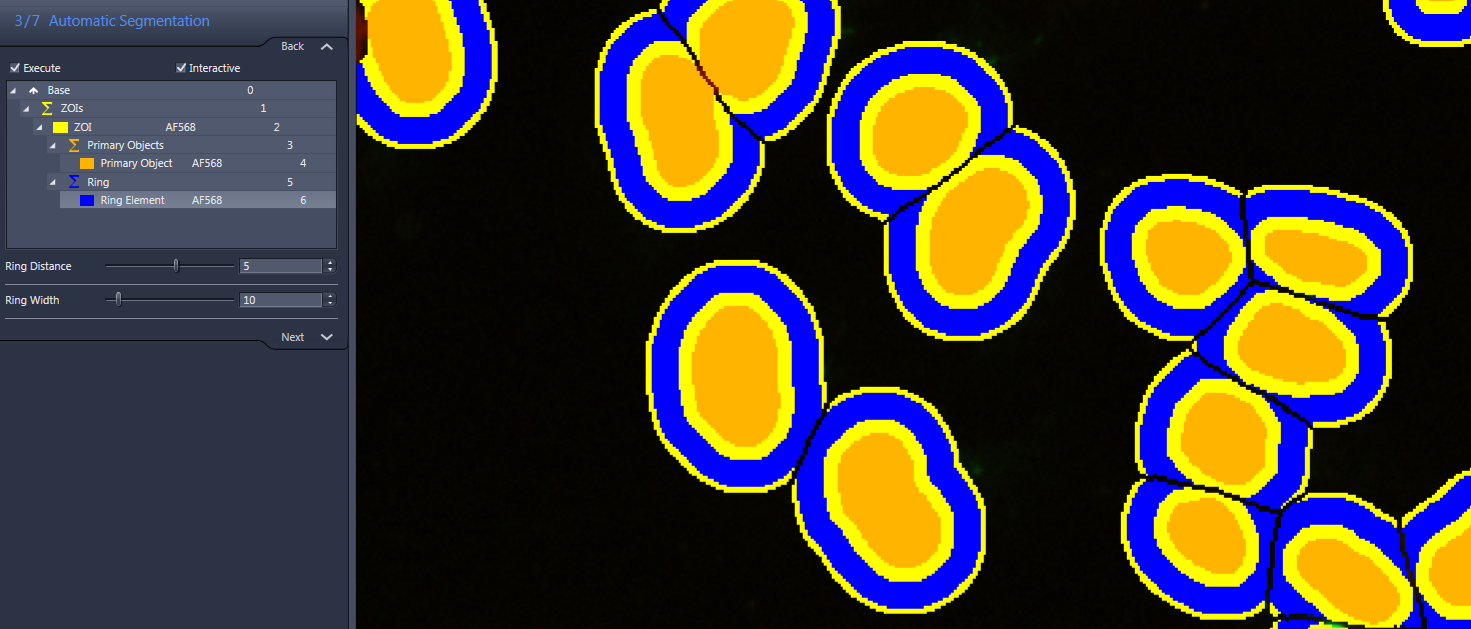
- To modify Ring Distance and Width, select the Ring Element class.
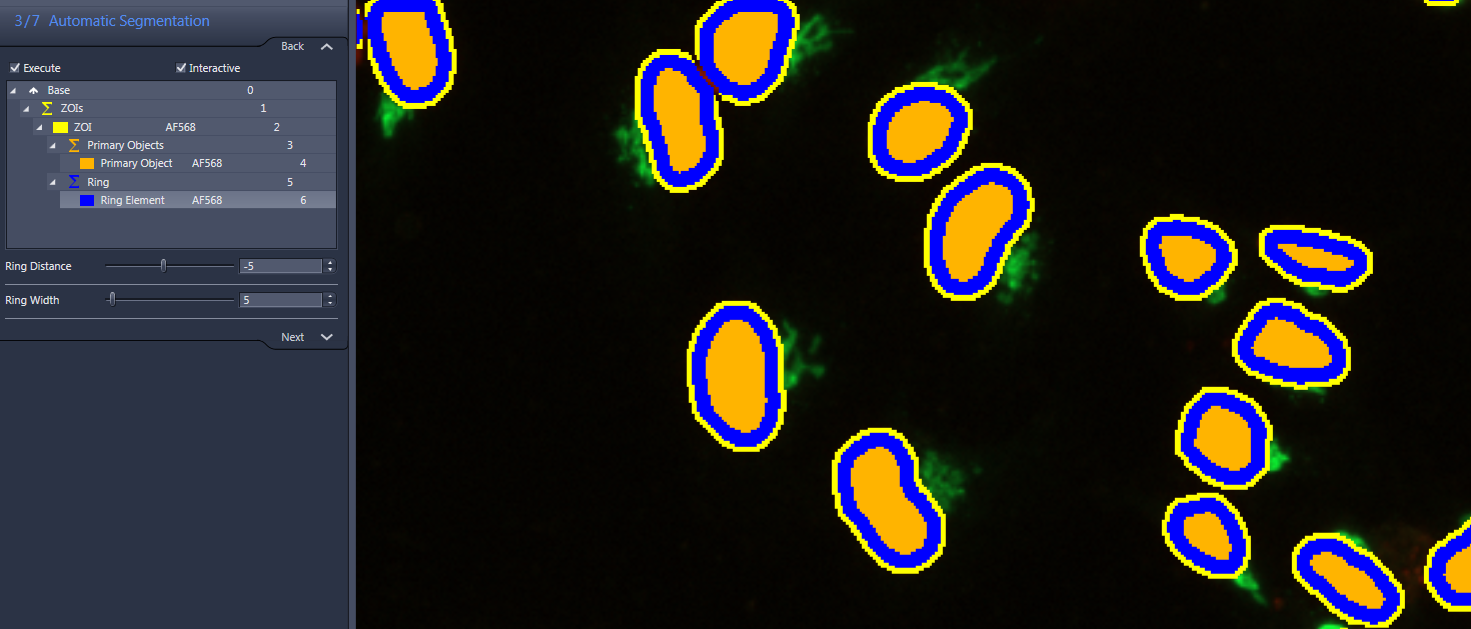
- Now, you can define the location and dimension of the ring flexibly. You can set it at the edge of the main object or inside the main object. You can also define an arbitrary distance.
- Define the following parameters:
- Ring Distance: Distance from surface of the primary object. Negative values means that the ring starts at the defined distance within the primary object. Ring Width: Defines the width of the ring.
- The ZOI is automatically adapted to exceed the class with the larger diameter, i.e. either ring or primary object, by at least 3 pixels (default setting).
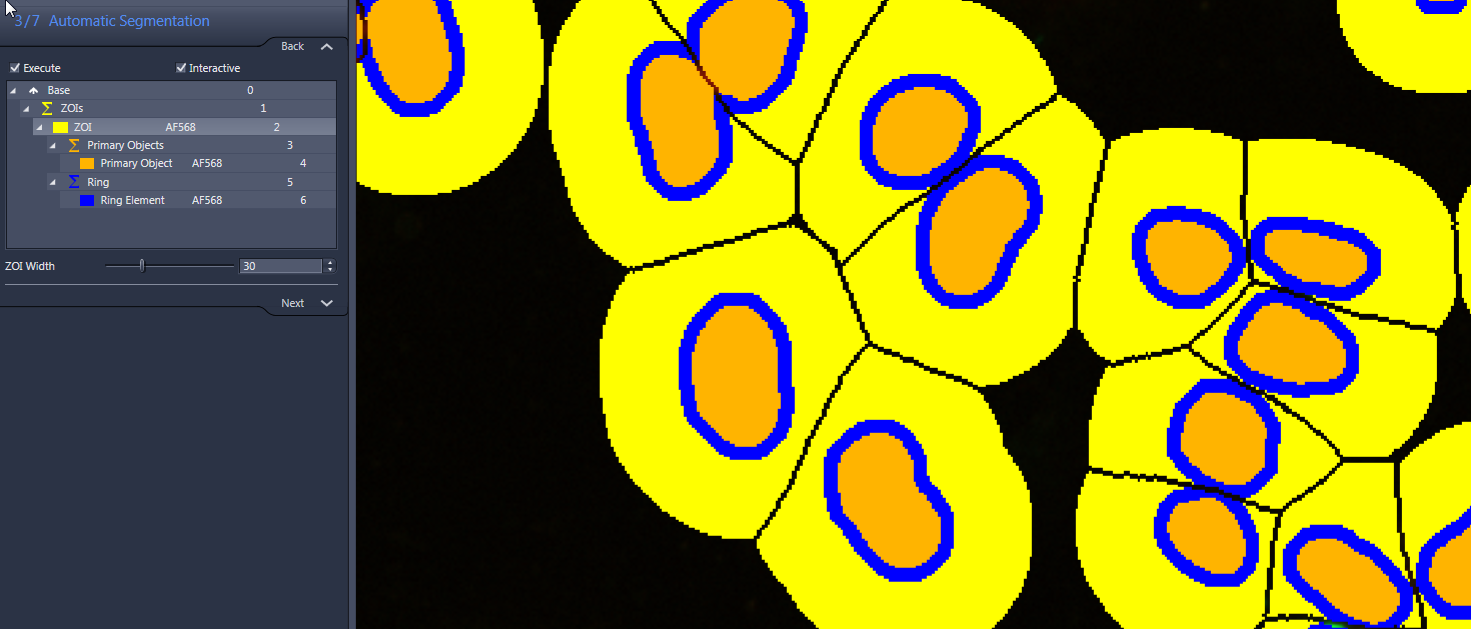
Modifying the ZOI Width
- Select ZOI-class, and with the ZOI Width slider, set the distance. You can set the distance between the outer border of the ZOI and the outer border of either ring or primary object, respectively. The ZOI Width is at least 3 pixels larger than either the ring or the primary object, whichever is larger. The ZOI area incorporates also the area of the ring and the primary object, and thus can serve for example for measuring features over the complete cell.
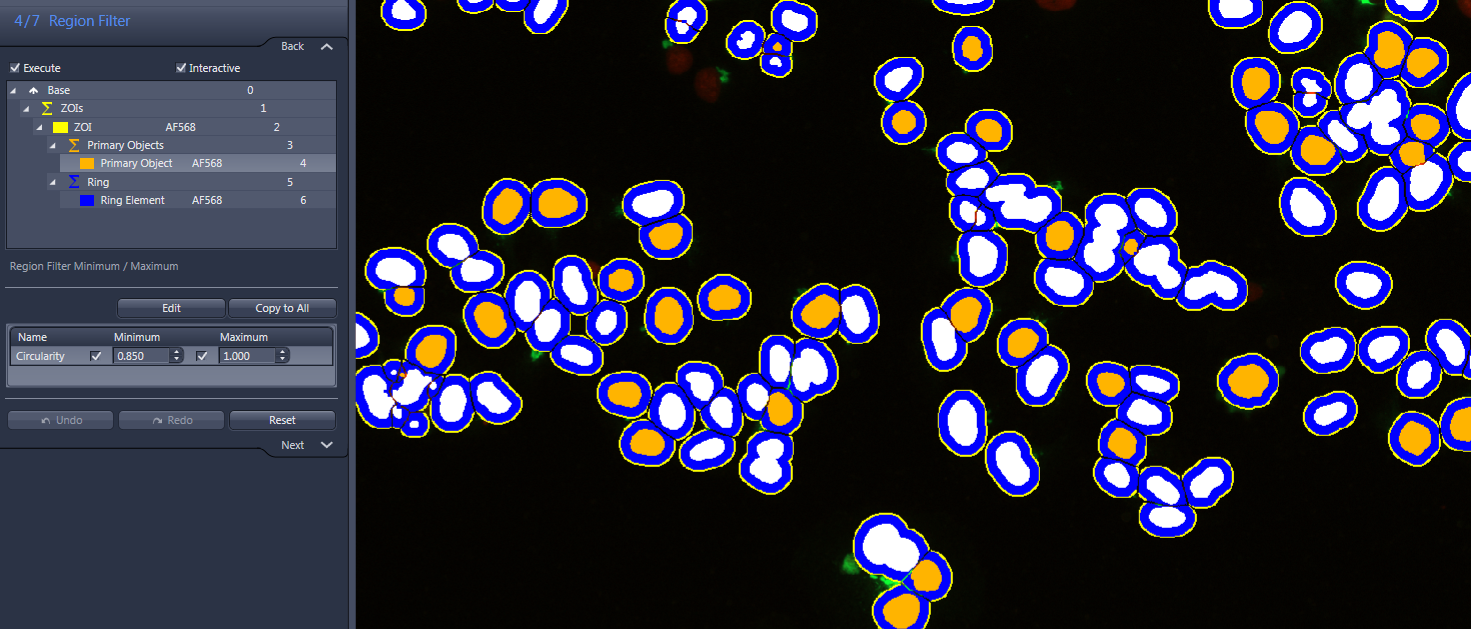
Step 4: Region Filter
You can define conditions for the primary objects (and additionally defined subclasses) to be measured, e.g. include only objects of a certain size, shape, intensity or other parameters. You can define suitable parameters for each of the defined objects.
- Select the Primary Object and click Edit. From the list of features on the right, you can add features via double-click. Once you have added all desired features, click OK.
- The selected conditions appear in the left tool area.
- Set the minimum and maximum values by clicking on the objects with the desired features, or by entering the numbers directly.
The following figure is an example and shows the result if a certain condition of the circularity of each primary object needs to be fulfilled.
Step 5: Features
You can define individual measurement features for each class. You can copy the measurement features defined for one class to the other classes via Copy to all.
- Select the class for which you want to define measurement features, and click Edit. From the list of features on the right you can add features to the selected features list on the left.
- These features are automatically calculated for every object during image analysis. All classes have the ID of the parent and ID as default features. With these IDs you can later group the associated parameters from the result excel lists, if necessary.
- The class Ring additionally has Area and Count as default parameters.
- To attribute the mean intensity for channel AF488 (the mitochondria) measured on the Ring to the Primary Object, select Ring and click Edit. The Feature Selection window opens.
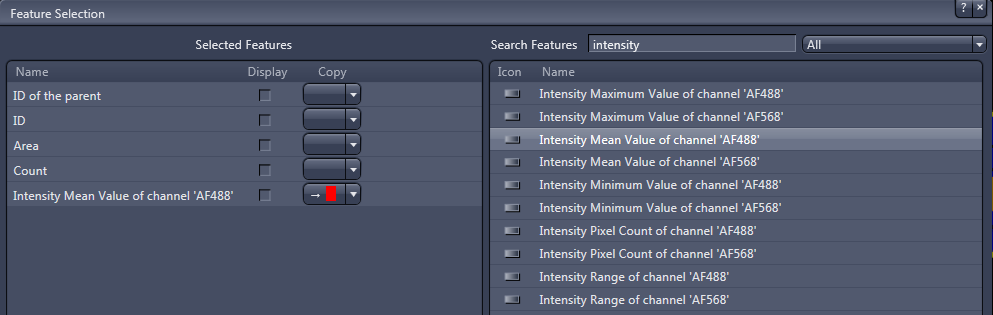
- From the feature list on the right select Intensity Mean Value of channel AF488 and add it to the selected features on the left. In the Copy column, from the drop-down menu in the Intensity Mean Value of channel AF488 row, click
 .
. - This measurement feature is copied to the corresponding Primary Object.
Step 6: Result Preview
In this step you see a preliminary result of the image analysis.
- Click on the different objects in the Analysis tab to get the preliminary measurement result for all objects.
- Click Finish, to save the analysis settings and close the wizard.
- The wizard closes. The analysis settings are saved.
Executing the Analysis Setting
You have the following options to run a predefined image analysis setting on your data set:
- Start Interactive Analysis: Analyze interactively with all steps that have been selected with the checkbox Interactive during setup of the image analysis.
- Start Analysis: Runs the image analysis setting without dialog.
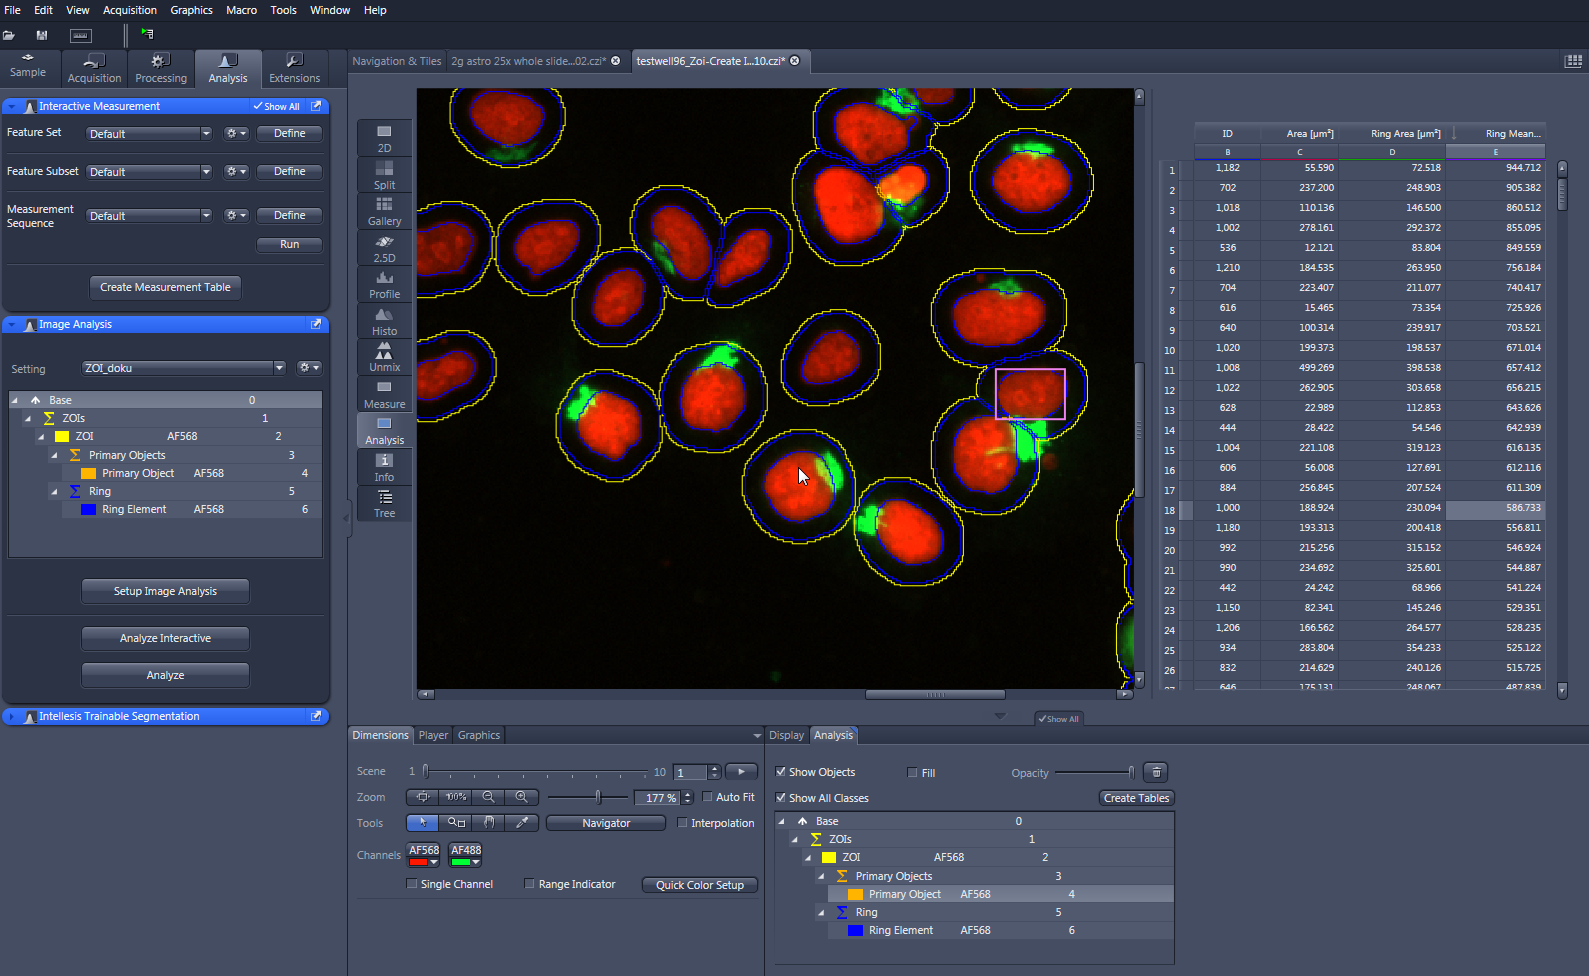
When the analysis is finished, the main view switches to the Analysis tab and displays the segmented image along with the results of the analysis.
Select the different objects to display the corresponding measurement tables. The data in the tables and the regions in the image are interlinked. A click on the object in the image highlights the corresponding line in the data table and vice versa.