ZEISS Microscopy Knowledge Base
Help
ZEISS Microscopy Knowledge Base
Search
Measuring Fluorescence Intensity in a Multichannel Image
This topic will show you how to set-up a measurement program using the Image Analysis Wizard. After the setup is successfully completed, the program will be used to measure fluorescence intensity in a multichannel image.
In this example we are using a multichannel image with 2 channels (1st channel blue, (DAPI) ), 2nd channel red (mRFP1)) of fluorescence-stained cells. First, we detect the blue-stained cell nuclei in the first channel. Then we measure the fluorescence intensity for both channels for the detected nuclei.
See also
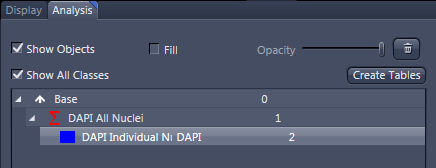
Step 1: Classes
- You have created a new image analysis setting with the Segment region classes independently method and opened the Image Analysis Wizard, see Creating a New Image Analysis Setting.
- In the Classes step, click on Class 2 in the list and enter DAPI Individual Nuclei in the Name input field.
- Click on Classes1 in the list and enter DAPI All Nuclei in the Name input field.
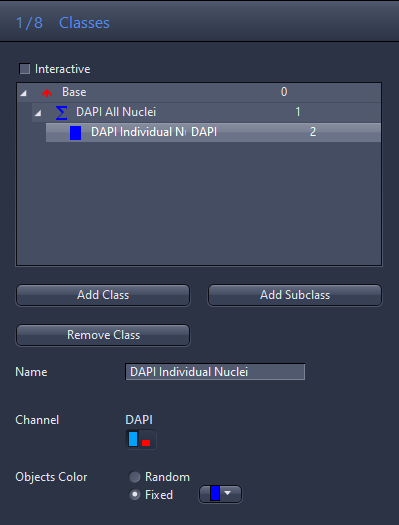
- Click Next.
Step 2: (Measurement frame)
- Deactivate the Interactive checkbox.
- Click on Next.
Step 3: Automatic Segmentation
- Select the DAPI Individual Nuclei entry in the list and select the Segmentation Method for the class (Global Thresholding).
- The parameters for the class are displayed.
- In the Threshold section, set the Tolerance parameter to 1%.
- Click in the image on the blue-stained cell nuclei.
- The detected nuclei are overlaid in blue. The threshold values are displayed in the Threshold section in the Low/High input fields.
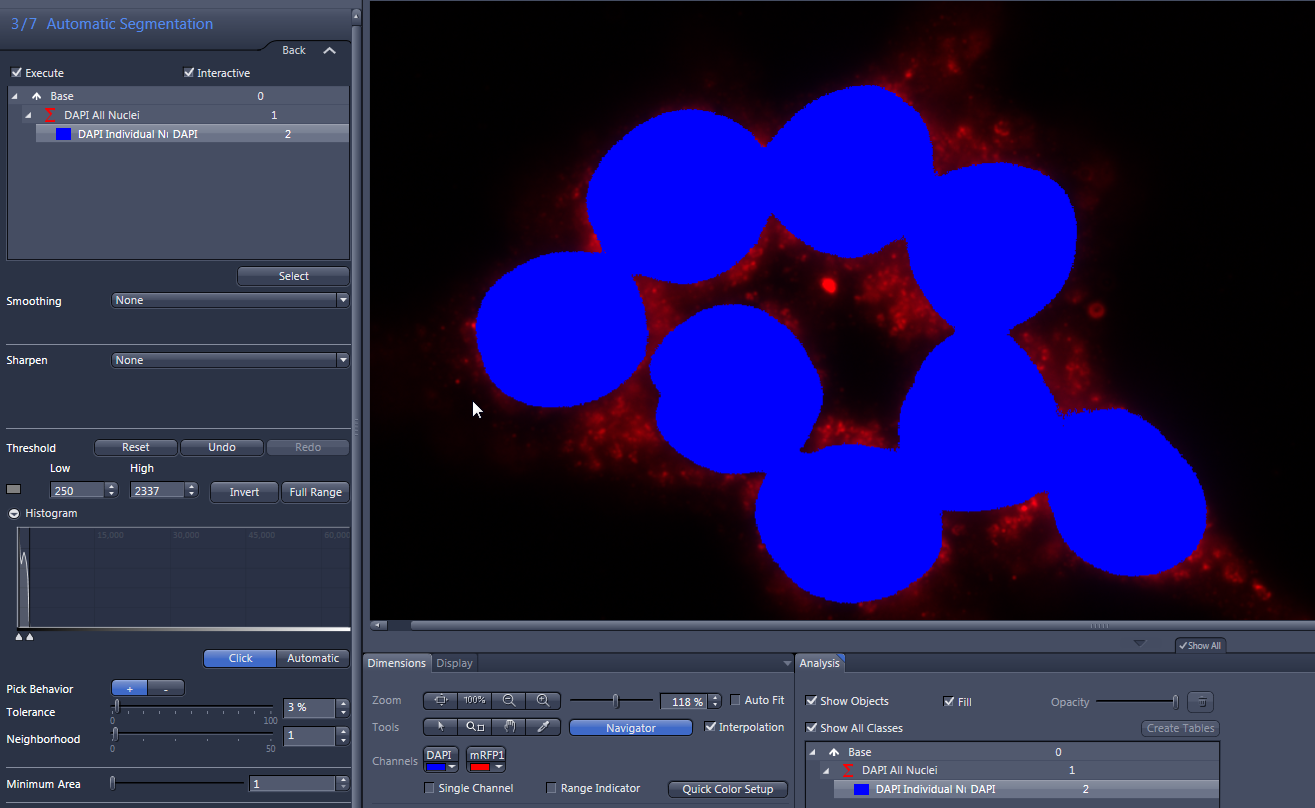
- Click on the areas of the blue cell nuclei that have not yet been detected until these have been completely overlaid.
- Set Fill Holes to On.
- This fills any holes in the detected cell nuclei.
- In the Separate section, select the Watersheds entry from the dropdown list and set the number to 3.
- Clear separation lines are now visible between the cell nuclei.
- Click Next.
Step 4: Region Filter
- Deactivate the Execute checkbox.
- Click on Next.
Step 5: Interactive Segmentation
- Deactivate the Interactive checkbox.
- Click on Next.
Step 6: Features
- Click on the DAPI Individual Nuclei entry in the list.
- Click on the Edit button in the Region Features section.
- The Feature Selection dialog is opened.
- Double-click on Intensity Mean Value of channel "DAPI" and Intensity Mean Value of channel "mRFP1" features, one after another.
- The features are displayed in the Selected Features list on the left.
- Remove superfluous features (e.g. Area, Perimeter) from the list. Select the feature and click on the Delete button
 .
. - Activate the Display checkbox for the features.
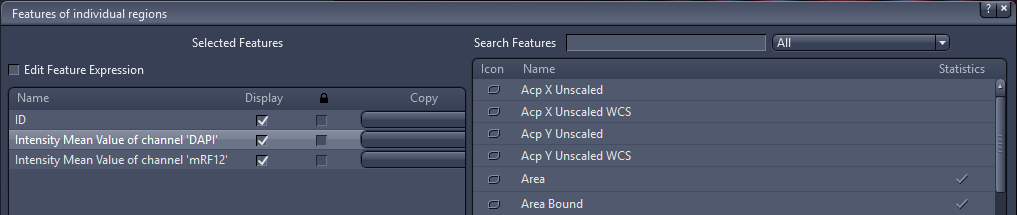
- Click on OK.
- The selected features are displayed in the Region Features section.
- In the section Annotation Options, activate the checkbox Color.
- Select Yellow from the drop-down list.
- Click on Next.
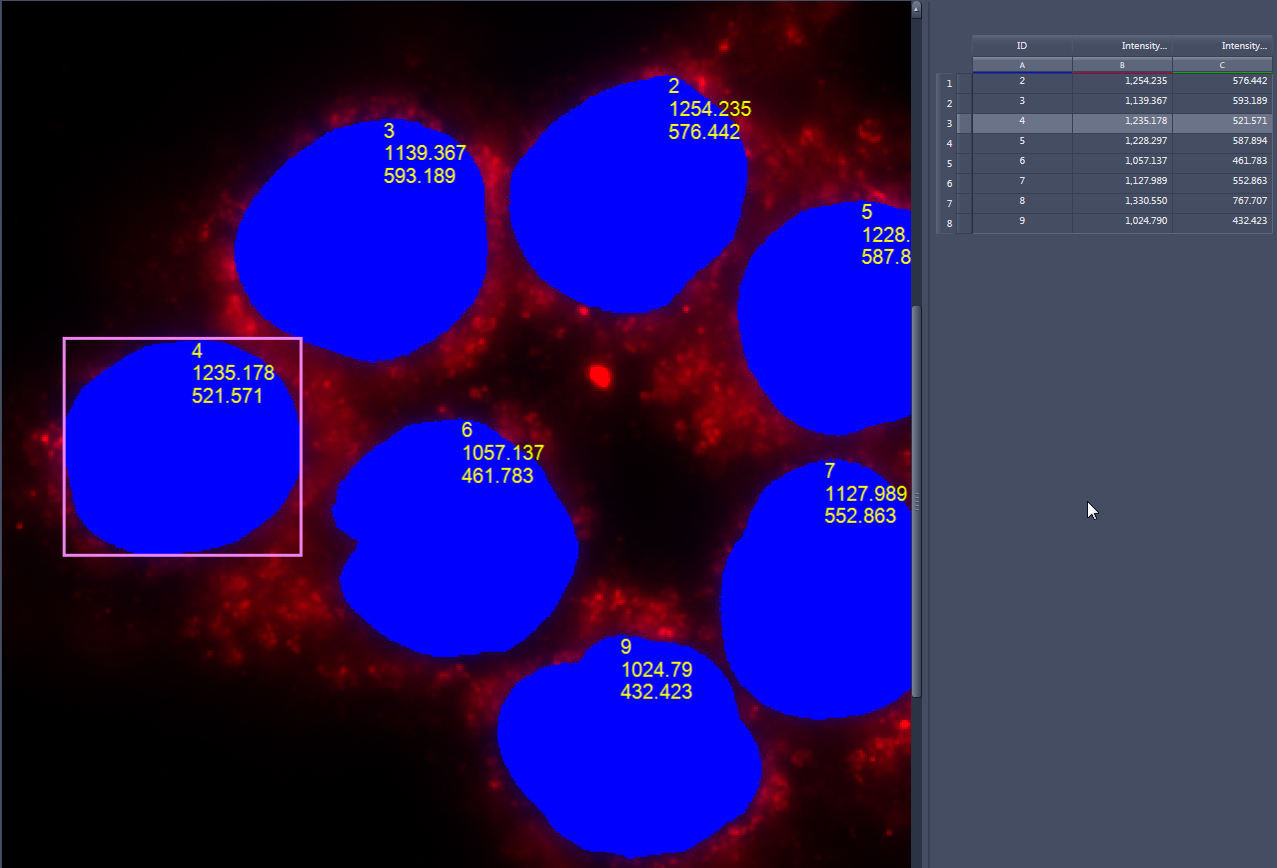
Step 7: Results Preview
- Click on DAPI All Nuclei in the list.
- The number of measured cell nuclei is displayed in the data table to the right of the image.
- Click on DAPI Individual Nuclei in the list.
- The object ID and the values for the average fluorescence intensities per channel are displayed in the image at the cell nuclei in question and in the data list to the right of the image.
- Click on the Finish button.
- This saves the measurement program.
Executing the Analysis Setting
- You are in the Image Analysis tool.
- You have loaded the analysis setting that you have generated.
- Click Start Analysis.
- The analysis setting is applied to the image.
- The Analysis View is displayed in the Center Screen Area.
- In the Analysis View you can see your image with the measured cell nuclei overlaid in blue and, to the right of this, the data list containing the individual measurements.
- Deactivate the Fill checkbox in the Analysis control element.
- The selected cell nuclei are displayed as contours.
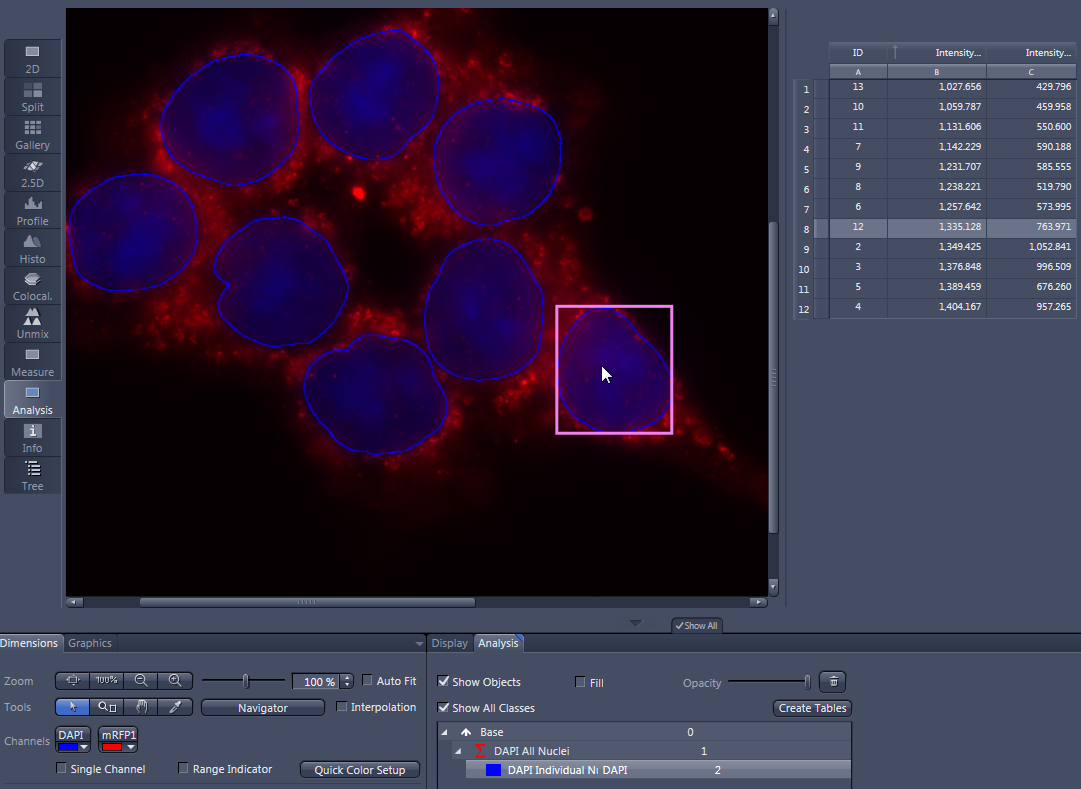
- Click on a row in the data list or alternatively on a cell nucleus in the image.
- The row in the data list containing the measurement values is highlighted. The associated cell nucleus is surrounded by a red rectangle.
There is a direct link between the measured cell nuclei in the image and the measured values in the data table. You can either click on a measured cell nucleus in the image or on a row in the data table.