ZEISS Microscopy Knowledge Base
Help
ZEISS Microscopy Knowledge Base
Search
Counting Number of Fluorescence Signals per Nuclei
This topic will show you how to set-up a measurement program using the Image Analysis Wizard. After this the program will be used to count the number of fluorescence spots in a multichannel image.
In this example we are using a multichannel image with 2 channels (1st channel blue (DAPI), 2nd channel green (GFP)) of fluorescence-stained cell nuclei. First, we detect the blue-stained cell nuclei in the first channel and then the green stained signals in the second channel. Then we measure the number of green fluorescence signals per nucleus.
See also
Step 1: Classes
- You have created a new image analysis setting with the Segment region classes independently method and opened the Image Analysis Wizard, see Creating a New Image Analysis Setting.
- In the Classes step, click on Classes1 in the list and enter Nuclei in the Name input field.
- Select a blue color from the dropdown list in the Color section.
- Click on the Class 2 entry in the list and enter Individual Nucleus in the Name input field.
- Click on the blue channel icon in the Channel section.
- For Object Color, click Fixed and select the blue color from the dropdown list.
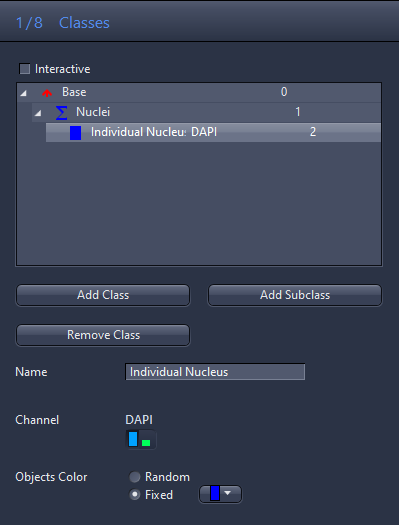
- You have now setup a class pair for the nuclei.
- Click Add Subclass.
- Click on Classes 3 in the list and enter Signals in the Name input field.
- Select a green color from the dropdown list in the Color section
- Click on the Class 4 entry in the list and enter Individual Signal in the Name input field.
- Click on the green channel icon in the Channel section.
- For Object Color, click Fixed and select the green color from the dropdown list.
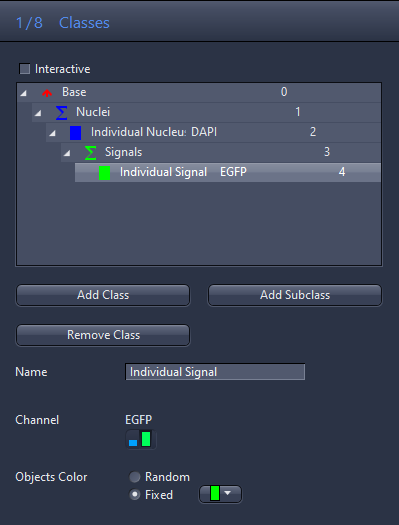
- You have now setup a subclass for the signals inside the individual nucleus class (parent class).
- Click Next.
Step 2: Measurement Frame
- Deactivate the Interactive checkbox.
- Click on Next.
Step 3: Automatic Segmentation
- Click on the Individual Nucleus entry in the list and select the Segmentation Method for the class (Global Thresholding).
- The segmentation parameters (Smoothing, Sharpen, etc.) are displayed below the list.
- In the Smoothing section, select Gauss from the dropdown list and set the parameter Sigma to 1.5.
- Click on the blue-stained cell nuclei in the image.
- The detected nuclei are overlaid in blue. The threshold values are displayed in the Threshold section in the Low/High input fields.
- Click on the areas of the blue cell nuclei that have not yet been detected until these have been completely overlaid.
- In the Separate section, select the Watersheds entry from the dropdown list and set the number to 17.
- Clear separation lines are now visible between the cell nuclei.
- Click on the Individual Signal entry in the list.
- The segmentation parameters are displayed below the list.
- In the Smoothing section select Gauss from the dropdown list and set the parameter Sigma to 1.5.
- Click in the image on the green-stained signals.
- The detected signals are overlaid in green. The threshold values are displayed in the Threshold section in the Low/High input fields.
- Click on the areas of the green signals that have not yet been detected until these have been completely overlaid.
- Set Fill Holes to On.
- This fills any holes in the detected signals.
- In the Separate section, select the Watersheds entry from the dropdown list and set the number to 17.
- Clear separation lines are now visible between the signals.
- Click Next.
Step 4: Region Filter
- Deactivate the Execute checkbox.
- Click on Next.
Step 5: Interactive Segmentation
- Deactivate the Interactive checkbox.
- Click on Next.
Step 6: Features
- Click on the Nuclei entry in the list.
- Click on the Edit button in the Regions Features section.
- The Feature Selection dialog is opened.
- Double-click in the right-hand list on the ID.
- The features are displayed in the Selected Features list on the left.
- Remove superfluous features from the list. Select the feature and click on the
 Delete button.
 - Click on the Individual Nucleus entry in the list.
- Click on the Edit button in the Features of individual regions section.
- The Feature Selection dialog opens.
- Double-click in the right-hand list on the ID of the parent.
- The features are displayed in the Selected Features list on the left.
- Remove superfluous features (e.g. Area, Perimeter) from the list. Select the feature and click on the Delete button.
- Click on the Signals entry in the list. This list contains the statistical features of the individual signals.
- Click on the Edit button in the Regions Features section.
- The Feature Selection dialog opens.
- Double-click in the right-hand list on the ID, Count.
- The features are displayed in the Selected Features list on the left.
- For the newly added feature Count, open the Copy drop-down menu and select Copy to the parent single region.
- The feature is copied to the results table of the parent, in this case the individual nucleus.
- Remove superfluous features from the list. Select the feature and click on the Delete button.
- Click on the Individual Signal entry in the list.
- Click on the Edit button in the Features of individual regions section.
- The Feature Selection dialog opens.
- Remove superfluous features (e.g. Area, Perimeter) from the list. Select the feature and click on the Delete button.
- Click on the OK button.
- The selected features are displayed in the Regions Features section.
- Click on Next.
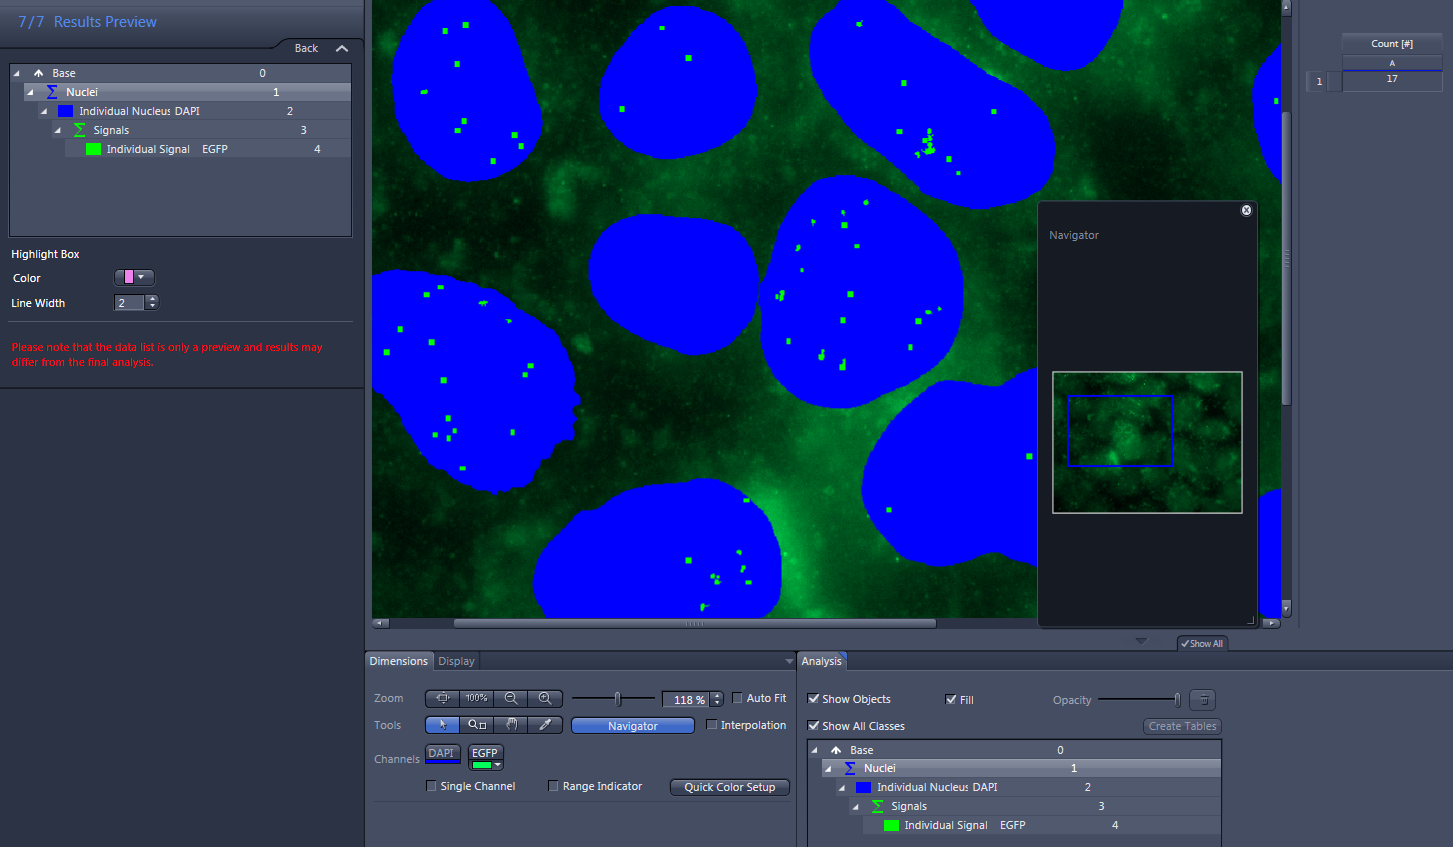
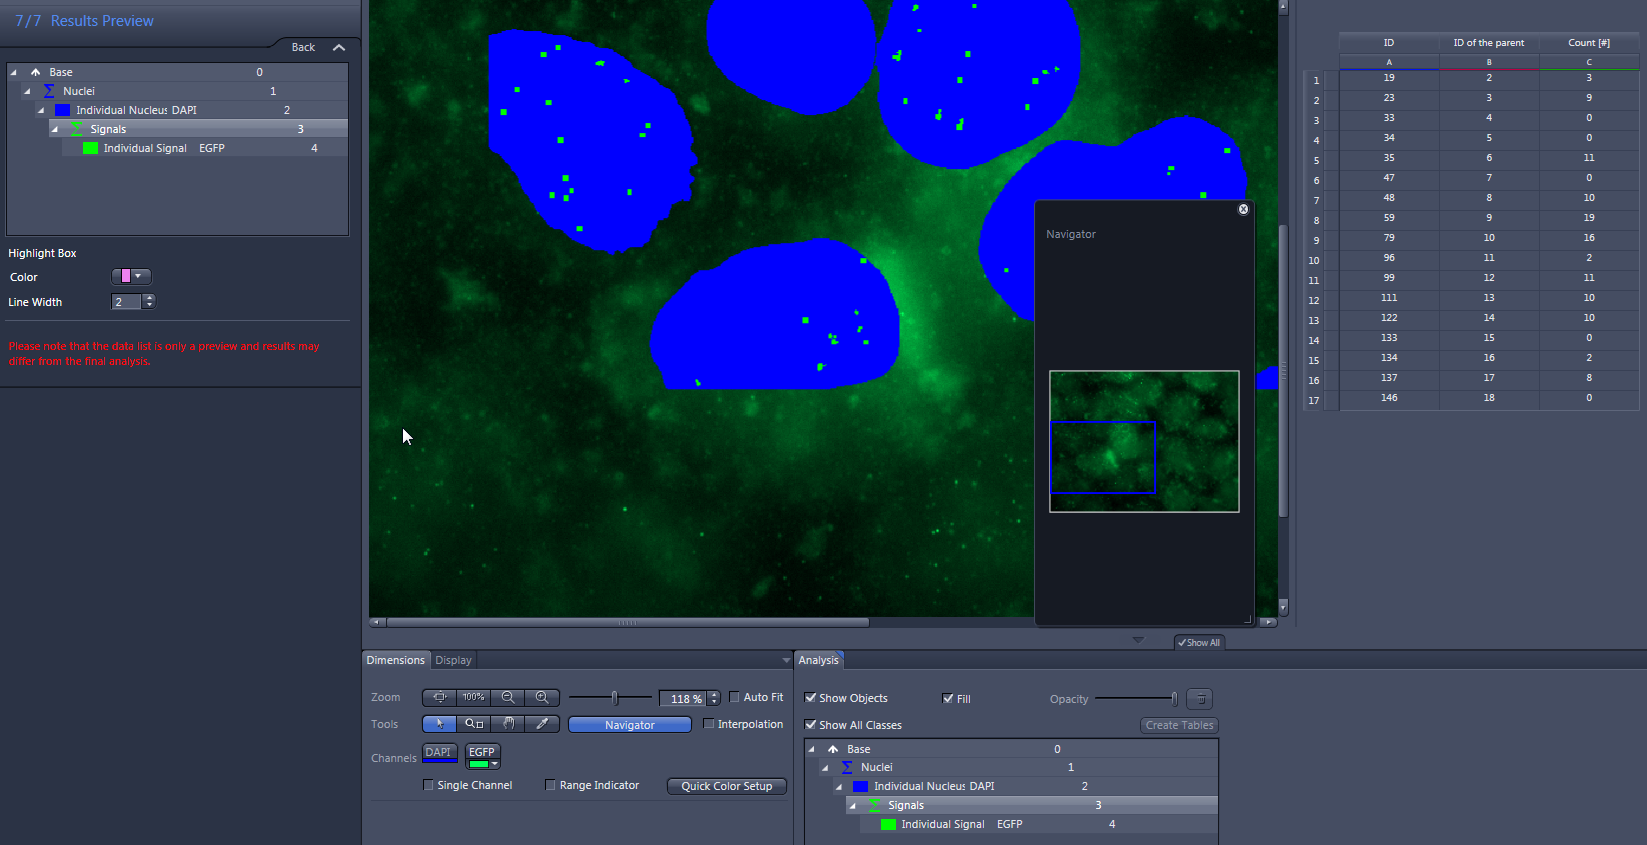
Step 7: Results Preview
- Click on Nuclei in the list.
- The number of measured nuclei is displayed in the data table to the right of the image.
- Click on Individual Nucleus in the list.
- The ID of the parent, the ID and Signals Count (the number of green signals) of the measured nuclei is displayed in the data list to the right of the image.
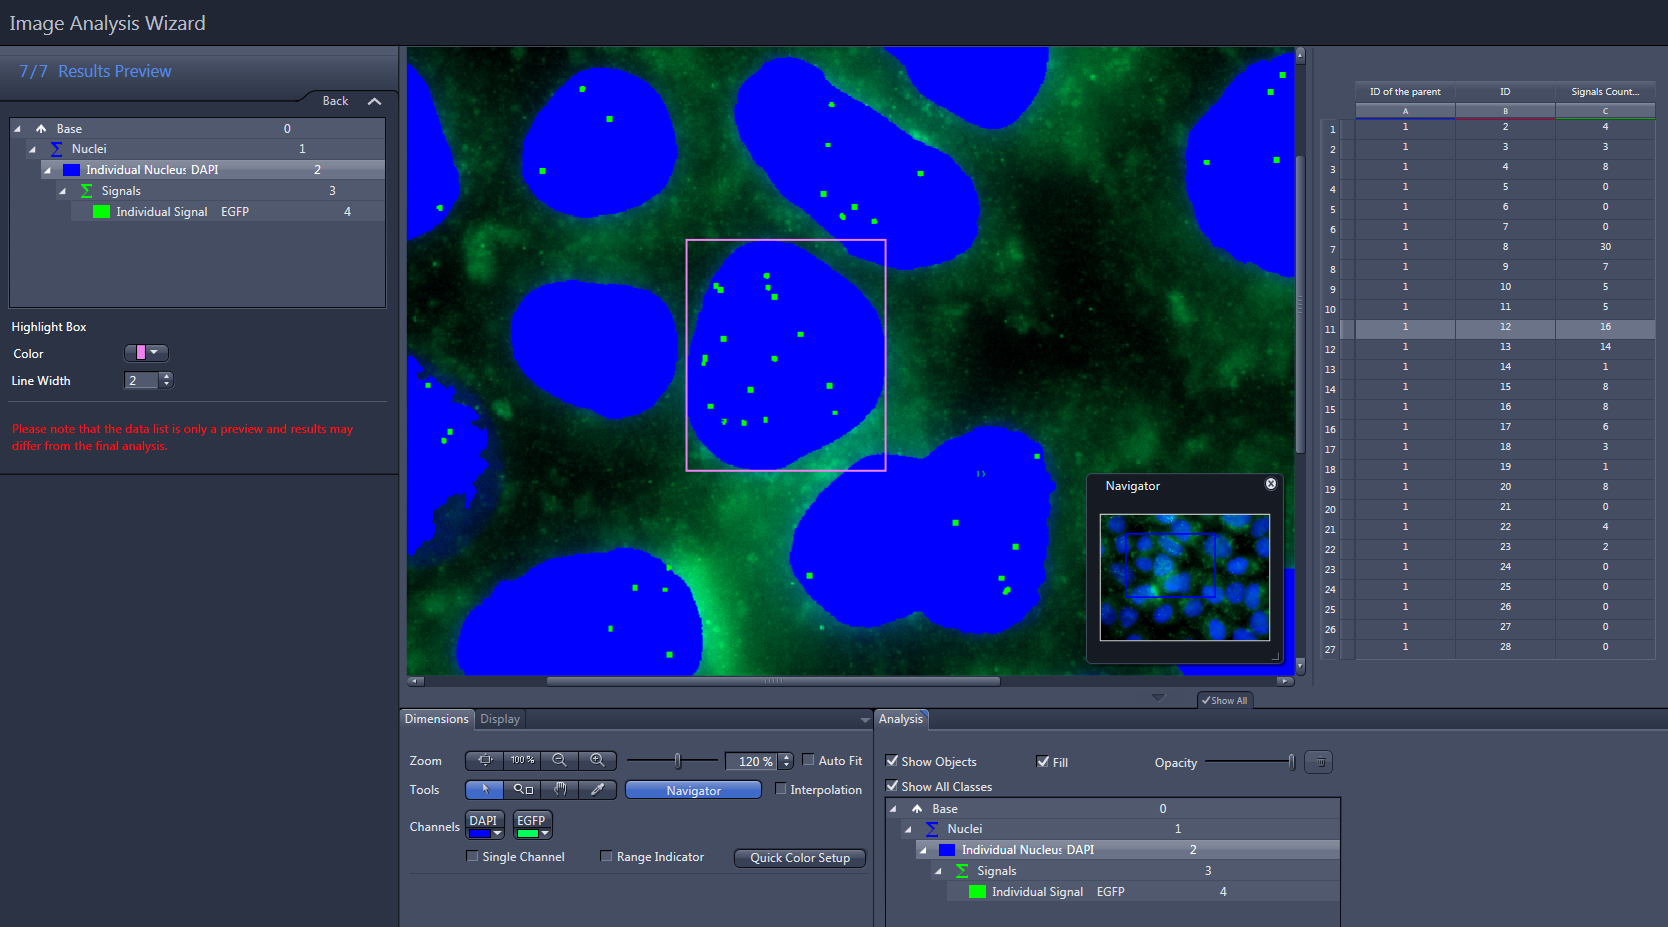
- Click on Signals in the list.
- The ID of the parent (corresponds to the ID of the nucleus) and the number of measured signals are displayed in the data table to the right of the image.
- Click on the Finish button.
- This saves the measurement program.
Executing the Analysis Setting
- You are in the Image Analysis tool.
- You have loaded the analysis setting that you have generated.
- Click Start Analysis.
- The analysis setting is applied to the image.
- The Analysis View is displayed in the Center Screen Area.
- In the Analysis View you see your image with the measured cell nuclei overlaid in blue and the signals overlaid in green. Right of this, you see the data list containing the number of signals per nucleus.
![Software window showing blue nuclei with green signals, right table labeled ID and Count [#], DAPI and EGFP channels](https://ariviskbdevwe.blob.core.windows.net/cdn/downloads/blobs/2c262244100a36ec2ed8e84fbc5d7425.webp)
- Only the number of signals of measured nuclei is displayed. Nuclei touching the frame are not taken into account.