Colocalization Table
Only visible if the Table checkbox is activated on the Coloc. Tools tab.
For each quadrant of the scatter plot there is a corresponding row in the table. The table contains columns for the different measured values with the Global row containing the values for the entire image.
Region
Once a region has been selected it has a number assigned to it. This number appears in the image and in the table.
Quadrant
Indicates the measured values for the four quadrants of the scatter plot.
Pixel Number
Shows the total number of pixels of each quadrant. The sum of all pixels in this column for all 4 quadrants corresponds to the product of the height x width of the original image.
Area (µm²)
Area = number of pixels x scaling factor for X/Y
If there is no scaling for the original image, the following applies: 1 pixel = 1 µm.
Relative Area (%)
Relative area = area of quadrant/total area
Pearson's Correlation Coefficient
Provides information on the intensity distribution within the colocalization region.
Value range: -1 to 1.
1: All pixels are on a straight line in the scatter plot from bottom left to top right (if, for example, you have used the same channel twice for the colocalization, you will find the value 1 in this column).
0: The pixels in the scatter plot are distributed in a cloud without a preferred direction.
-1: The pixels do not overlap. The scatter plot stretches from top left to bottom right. This situation can be described as negative colocalization and means "exclusion".
The calculation formula is as follows:
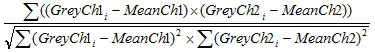
GV: Gray Value; AV: Average Gray Value; C: Channel
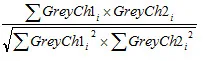
Manders' Correlation Coefficient
Insensitive to differences in the signal intensity between the two channels and bleaching.
Value range: 0 to 1
The calculation formula is as follows:
Coloc. Coefficient 1
This coefficient indicates the relative number of colocalized pixels in channel 1 in relation to the total number of pixels above the threshold value:
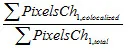
The values range between 0 and 1, with 0 indicating no colocalization and 1 indicating full colocalization.
Numerator = Number of pixels in quadrant 3
Denominator = Number of pixels in quadrant 3 + number of pixels in quadrant 1
Coloc. Coefficient 2
This coefficient indicates the relative number of colocalized pixels in channel 2 in relation to the total number of pixels above the threshold value:
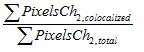
The values range between 0 and 1, with 0 indicating no colocalization and 1 indicating full colocalization.
Numerator = Number of pixels in quadrant 3
Denominator = Number of pixels in quadrant 3 + number of pixels in quadrant 2
CC (Weighted) 1
Weighted correlation coefficient channel 1. Calculated like the simple colocalization coefficient, but using the sum of the gray value intensity rather than the number of pixels.
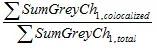
The values range between 0 and 1, with 0 indicating no colocalization and 1 indicating full colocalization.
Numerator = Sum of intensity of all pixels in quadrant 3
Denominator = Sum of intensity of all pixels above the threshold value
CC (Weighted) 2
Weighted correlation coefficient channel 2. Calculated like the simple colocalization coefficient, but using the sum of the gray value intensity rather than the number of pixels.
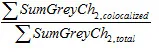
The values range between 0 and 1, with 0 indicating no colocalization and 1 indicating full colocalization.
Numerator = Sum of intensity of all pixels in quadrant 3
Denominator = Sum of intensity of all pixels above the threshold value
Average Intensity 1
The sum of all gray values from channel 1, divided by the total number of pixels in this channel:

Average Intensity 2
The sum of all gray values from channel 2, divided by the total number of pixels in this channel:

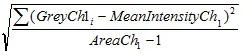
Standard Deviation 1
Displays the standard deviation of the gray values in channel 1:
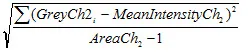
Standard Deviation 2
Displays the standard deviation of the gray values in channel 2:
Z Index
Displays the Z index for Z-stack images.
T Index
Displays the time index for time lapse images.
Relative Time
Displays the time of acquisition for all dimensions of a multidimensional image, beginning at 0h:00min:00sec:00msec.
Relative Focus
Displays the relative focus position at which an image has been acquired.
ON THIS PAGE
- Colocalization Table
- Region
- Quadrant
- Pixel Number
- Area (µm²)
- Relative Area (%)
- Pearson's Correlation Coefficient
- Manders' Correlation Coefficient
- Coloc. Coefficient 1
- Coloc. Coefficient 2
- CC (Weighted) 1
- CC (Weighted) 2
- Average Intensity 1
- Average Intensity 2
- Standard Deviation 1
- Standard Deviation 2
- Z Index
- T Index
- Relative Time
- Relative Focus