Layer Thickness Measurement
This module enables you to measure layers of sample images in accordance with the standards ASTM B 487 - 24 and DIN EN ISO 1463 - 2021. Layers to be measured are detected using image-analysis techniques and measured with the help of chords. The result of this measurement is a clearly structured report containing images and measurement data.
See also
The Concept
The operating concept of the Layer Thickness Measurement module is designed to make it possible to achieve a reproducible result with as little interaction as possible.
To perform a measurement, you need extensive knowledge of systems engineering and the respective application. Carelessly made alterations of a setting can promptly lead to faulty measurement results. It is important, therefore, to prevent users not having such knowledge from changing the basic settings. This is achieved by dividing up the tasks involved into the definition of an analysis and the performance of an analysis. For this reason, the operation of the module sticks to the general operating concept of the software:
- Creating and Managing Jobs (Supervisor)
- Create job templates for layer thickness measurement, manage templates, view job results, sign & release jobs (with GxP module only). Note that under Job Mode you will find a sample workflow within a pre-defined job template for layer thickness measurement.
- Running Jobs (Operator)
Performing graphite analysis using pre-defined job templates.
See also
General Preparations
A pre-defined job template is included in the software, when you have licenced the Layer Thickness Measurement module. You can modify the job template, see Working with Job Templates.
In the templates list you see the available job templates. Select an entry in the list, and from the context menu, open the corresponding job template. The job templates generally contain three major tasks:
|
1 |
Filling out an Input Form In this step the operator has to fill out the input form with user and sample specific information, e.g. Sample Information, User Name, etc. |
|
2 |
Performing the Analysis In this step the analysis will be performed according to the selected method. The detailed workflow will be described in the following sections. |
|
3 |
Creating a Report After the analysis a report will be generated containing the job results (images, measurements, etc.). |
General Analysis Workflow
The analysis steps of the workflow contain the following substeps to be executed. In this example the substeps are created within a Loop Task (1), meaning all included steps will be repeated depending on the loop settings. Regarding this you can easily fulfill the normative requirements of repeating the identical steps of an analysis for several times.
Note that greyed out task icons are set to "Run silent". The task will not be shown when the workflow is executed. To activate them, right-click on the icon and deactivate the Run silent menu entry.
|
Workflow Step |
Description |
|
|---|---|---|
|
Loading an Image (2) |
Load your image which is to be analyzed. The workflow can be adapted to perform image acquisition tasks here as well. |
|
|
Validating the input image (2) |
This task is recommended to use right after loading or acquiring an image. Currently it will check if the input image has the correct scaling information. This is important to make sure the image can be processed correctly. |
|
|
Preprocessing the Image (2) |
Perform preprocessing on the image, e.g. set parameters for finding or filtering edges. |
|
|
Performing the Measurement (3) |
Perform the layer thickness measurement. |
|
|
Showing the Results View (4) |
The Results View is displayed containing the measurement results and statistics. |
|


Layer Thickness Measurement
This topic explains the preprocessing and measurement part of the Layer Thickness Measurement job template which is delivered with the software, see General Preparations and General Analysis Workflow.
Image Preprocessing
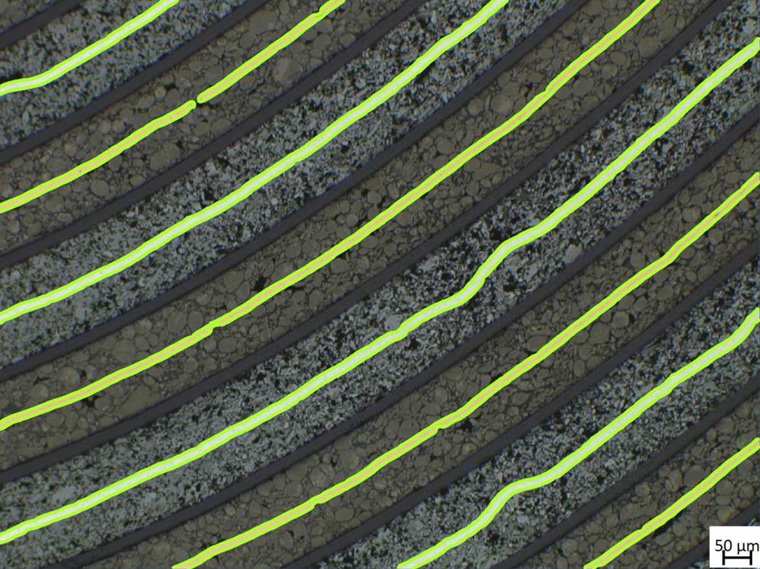
Within this step you can preprocess the image using the available tool parameters. When entering this step the software tries to detect the layers automatically. The edges of the layer will be marked by an overlay color. You can change the color of the overlay within the tool. Using the Rectangle button on top of the tool you can set up a measurement frame. The parameters under Find Edges and Filter Edges help you to detect and display the layers correctly.
Layer Thickness Measurement
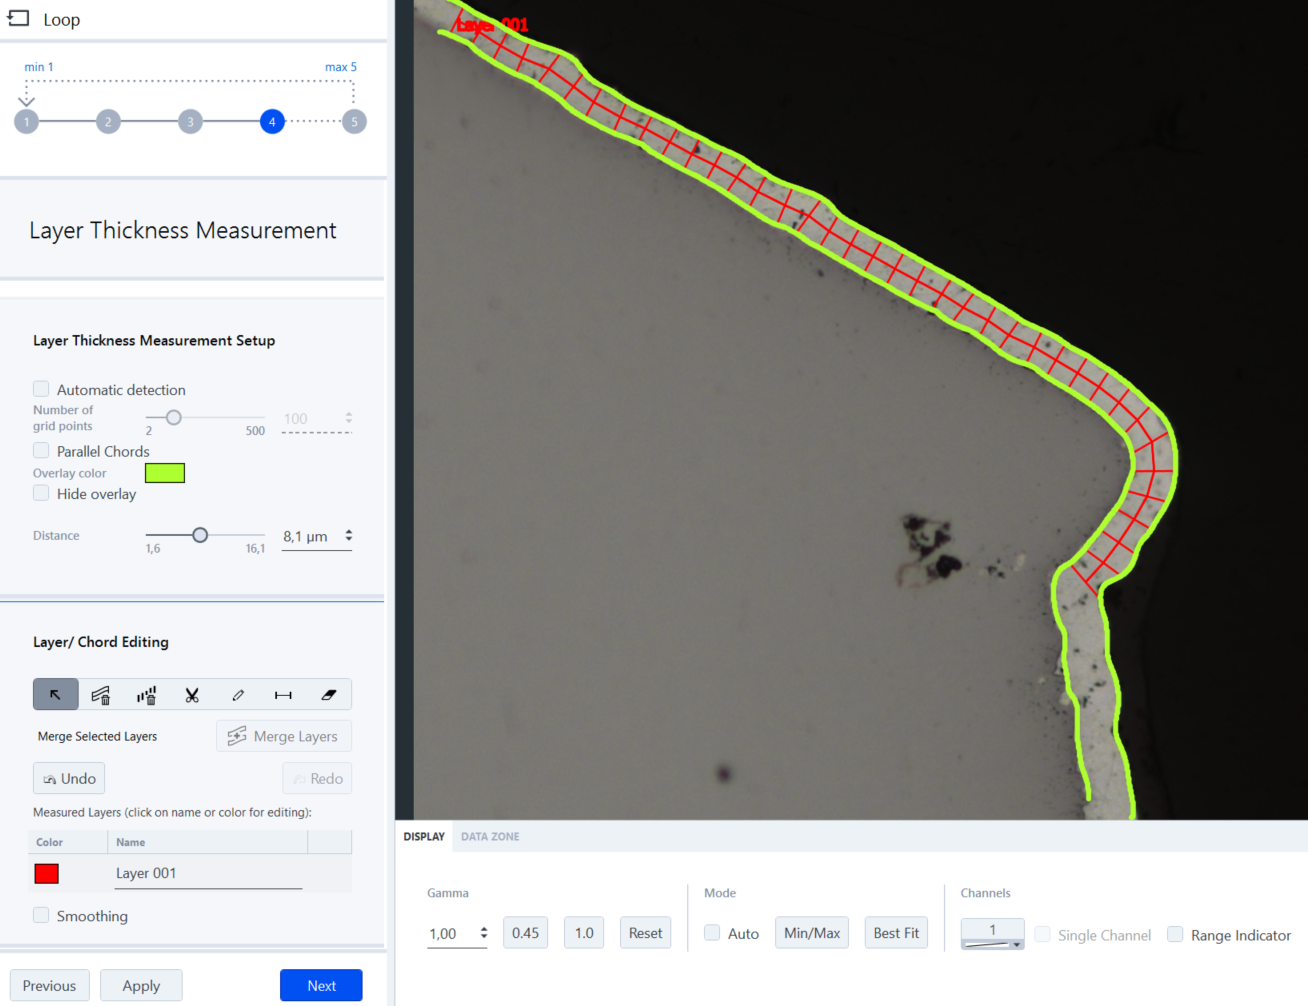
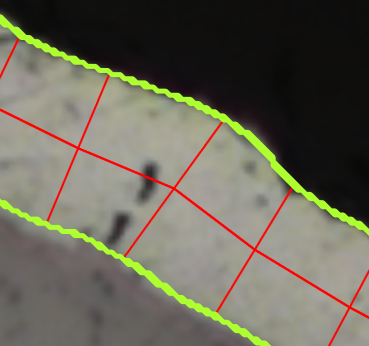
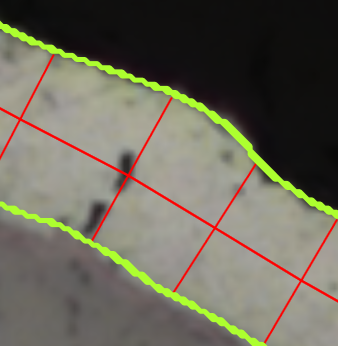
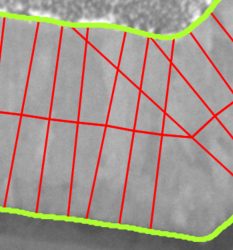
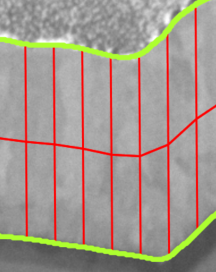
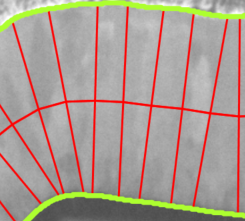
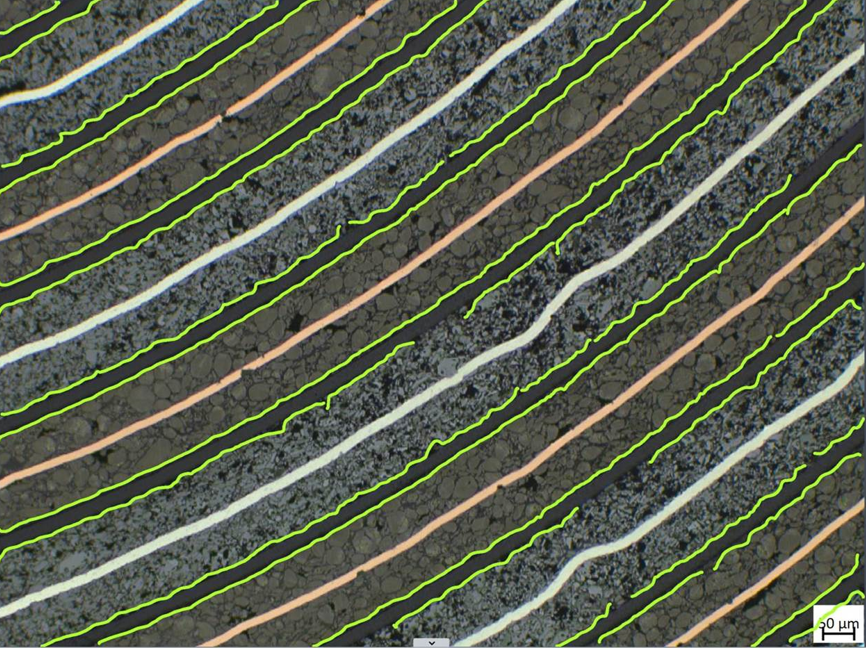
In this step you can set up the measurement and edit the detected layers/chords. To add a measurement click on the layer within two detected edges. The layer thickness measurement will be automatically applied to the image. Activate the Automatic Detection checkbox to add multiple layer thickness measurements automatically. This is needed if there are a lot of layers in your sample to be measured and you do not want to click on each of them separately.
If you activate the Parallel Chords checkbox, all chords will be brought in exact parallel order. It is deactivated by default. Activate the checkbox before clicking into the sample.
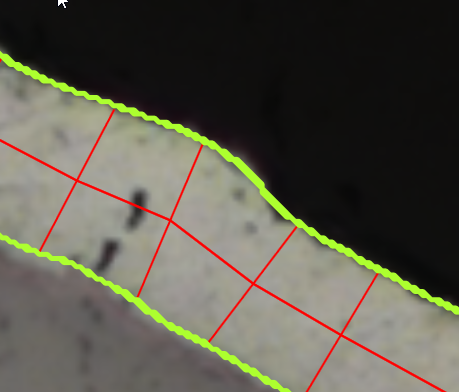
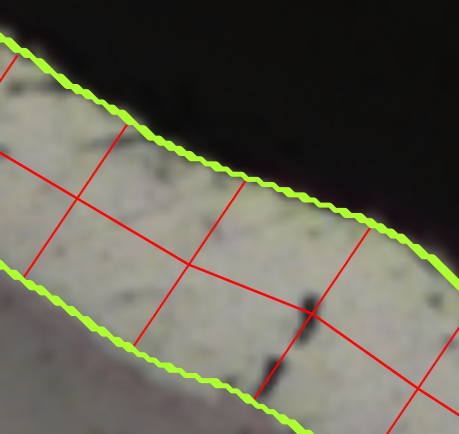
The layer thickness measurement will be displayed in line with a set of chords. In the Layer/Chord Editing tool the software provides a set of tools to edit the layers and chords after they have been added. You can remove, merge or cut layers and even edit single measurement chords. Furthermore, you can use a pen for drawing missing layer edges or use the eraser for removing wrongly detected layer edges. As a result, you will get detailed layer thickness measurements for each specific sample.
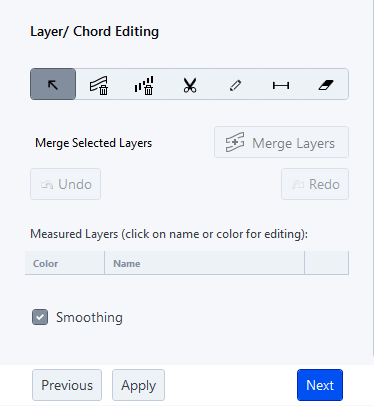
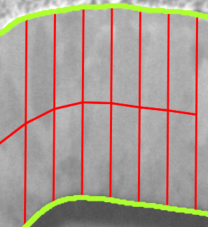
To correct the midline of each specific sample, activate the Smoothing checkbox. It is deactivated by default. If you activate it, the midline will be smoothed, if necessary. Activate the checkbox before clicking into the sample, otherwise Smoothing is not possible. It is available for manual setting and Automatic detection alike.
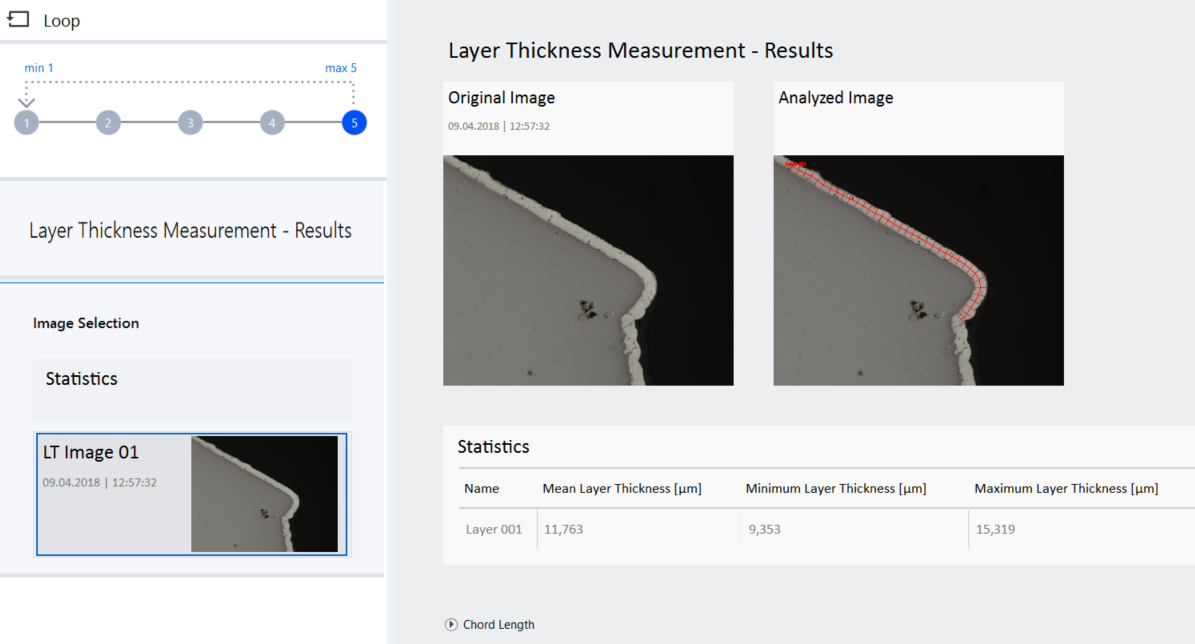
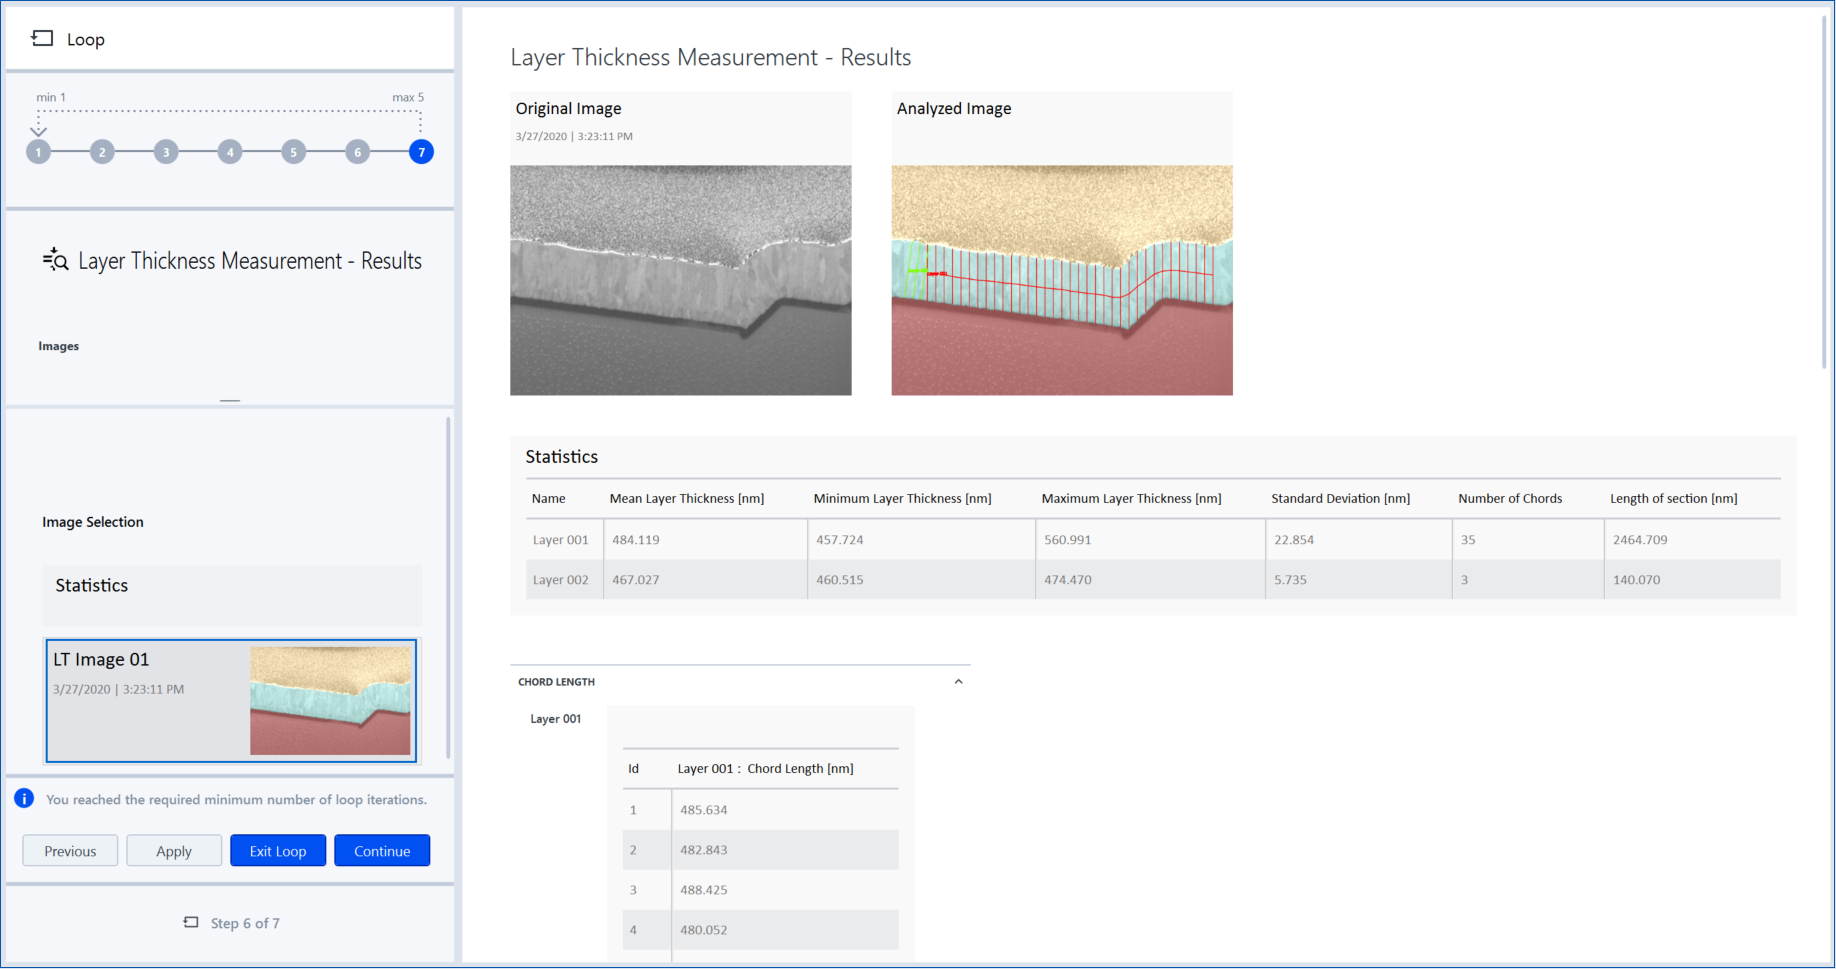
Result View
At the end of each analysis the Results view is displayed. It shows all images and results of the measurement performed. Additionally, the original images are displayed as well. In the Image Selection tool on the left side you can exclude images you do not want to have displayed within the result. If you click on the Statistics section within the tool, you can display all results of the analysis in a clearly structured table view.
The Length of section is also displayed in the table view. It is referring to the midline between chords.
Layer Thickness Measurement with Intellesis
This topic explains the preprocessing and measurement part of the Layer Thickness Measurement Intelesis job template which is delivered with the software, see General Preparations. For general information about Intellesis, see Intellesis Segmentation.
Image Processing
In the third step you have your Intellesis Segmentation step. Your input image is segmented based on a trained Model selected here. The segmentation output is fixed to Labels because this is required to detect the layer border in the later processing step.
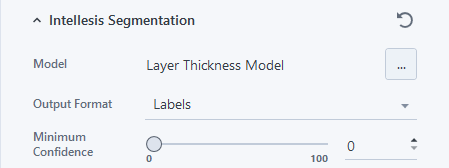
Image Preprocessing
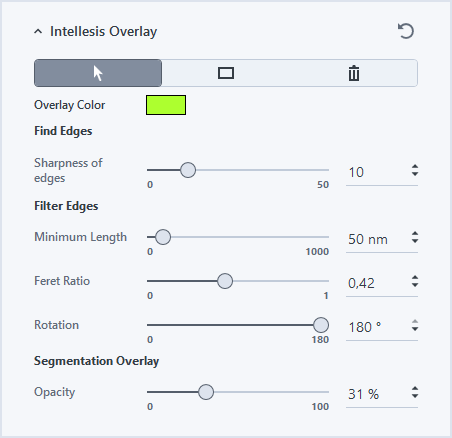
In this step you can preprocess the image using the available tool parameters. When entering this step the software tries to detect the layers automatically. The edges of the layer will be marked by an overlay color. You can change the color of the overlay within the tool. Using the Rectangle button on top of the tool you can set up a measurement frame. The parameters under Find Edges and Filter Edges help you to detect and display the layers correctly. Under Intellesis Overlay, you can set the Opacity of the segmentation result in the image. An opacity of 0% displays only the image, an opacity of 100% displays only the segmentation result.
Layer Thickness Measurement
In this step you can set up the measurement and edit the detected layers/chords. To add a measurement click on the layer within two detected edges. The layer thickness measurement will be automatically applied to the image. Activate the Automatic Detection checkbox to add multiple layer thickness measurements automatically. This is needed if there are a lot of layers in your sample to be measured and you do not want to click on each of them separately.
If you activate the Parallel Chords checkbox, all chords will be brought in exact parallel order. Activate the checkbox before clicking into the sample.
The layer thickness measurement will be displayed in line with a set of chords. In the Layer/Chord Editing tool the software provides a set of tools to edit the layers/chords after they have been added. You can remove, merge or cut layers and even edit single measurement chords. Furthermore, you can use a pen for drawing missing layer edges or use the eraser for removing wrongly detected layer edges. As a result, you will get detailed layer thickness measurements for each specific sample.
To correct the midline of each specific sample, activate the Smoothing checkbox. It is deactivated by default. If you activate it, the midline will be smoothed, if necessary. Activate the checkbox before clicking into the sample, otherwise smoothing is not possible. It is available for both manual setting and Automatic detection.
Result View
At the end of each analysis the Results view is displayed. It shows all images and results of the measurement performed. Additionally, the original images are displayed as well. In the Image Selection tool on the left side you can exclude images you do not want to have displayed within the result. If you click on the Statistics section within the tool, you can display all results of the analysis in a clearly structured table view. The Length of section is also displayed in the table view. It is referring to the midline between chords.
Adaptation of Detected Edges
Cleaning
This adaption is only needed, if the image contains significant noise.
This adaption removes all isolated pixels to remove noise form the image.
|
Effect without Cleaning |
Effect with Cleaning |
|
|
|
Sharpness of Edges
This parameter uses the Canny Tool to sharpen the detected edges.
- Use a lower value if the detected edges are clearly determinable and have high contrast.
- Use a higher value if the detected edges are blurry.
Minimum Length
This filter regards the length. Note that this is not an IP function.
Feret Ratio
Low value applies the filter for round objects. Note that this is not an IP function.
Rotation
Filters round outliers in an image with primary parallel layers. Note that this is not an IP function.
Layer Thickness Measurement Workbench
With this workbench you can set up the measurement and edit the detected layers/chords. Note that this task is not available in the Free Examination mode. It can be added only to job templates in the Create Job Template mode.
See also
Layer Chord Editing Tool
This tool enables you to edit the detected layers/chords.
|
Parameter |
Description |
|---|---|
|
|
Activated: Selects an element by clicking on it. |
|
|
Removes a layer. Click on the layer to remove it. |
|
|
Removes a measurement chord when you click on it. |
|
|
Cuts a layer when you click on it. |
|
|
Draws a layer with a polygon. Right-click to finish the process. |
|
|
Edits a chord of your choice. |
|
|
Erases a layer. Right-click to finish the process. |
|
Merge Layers |
Merges selected layers. |
|
Undo |
Undoes the last change. |
|
Redo |
Enables you to do the same process again. |
|
Measured Layers |
Lets you choose a color and a name for your selected layer. |
|
Smoothing |
Activated: Smooths the midline of your sample. |


See also
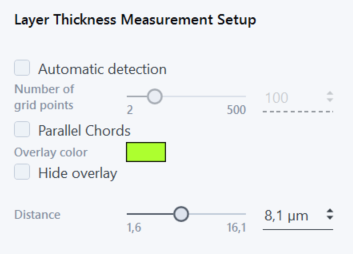
Layer Thickness Measurement Setup Tool
Within this step you can set the number of grid points you want to have in your layer image automatically as well the parallel chords function, the overlay color and the distance between chords.
|
Parameter |
Description |
|---|---|
|
Automatic detection |
Activated: Enables you to set the number of grid points. |
|
Number of grid points |
Sets the number of grid points for automatic detection. Use the slider to adjust the number. |
|
Parallel Chords |
Activated: All chords will be brought in exact parallel order. It is deactivated by default. The checkbox has to be activated beforehand. |
|
Overlay color |
Here you can select a certain color for the overlay image. Click on the colored field to select a desired color. You can choose one of the default colors or customize a color. |
|
Hide overlay |
Activated: The overlay color is not visible in the image. |
|
Distance |
Enables you to set the distance between chords. Use the slider to adjust the distance. |
See also
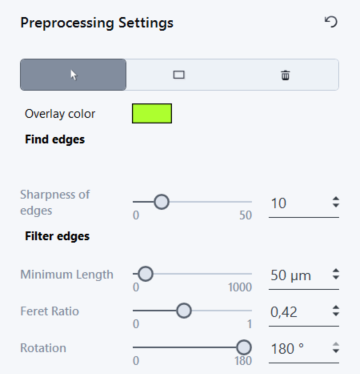
Preprocessing Settings Tool
This tool enables you to preprocess the image using the available tool parameters. When entering this step the software tries to detect the layers automatically. The edges of the layer will be marked by an overlay color. You can change the color of the overlay within the tool.
|
Parameter |
Description |
|---|---|
|
|
Selects a frame. |
|
|
Draws a frame. |
|
|
Removes a frame. |
|
Overlay color |
Here you can select a certain color for the overlay image. |
|
Sharpness of edges |
Sets the Sharpness of Edges. |
|
Minimum Length |
Sets the minimum length structures may have. Use the slider to adjust the length. |
|
Feret Ratio |
Sets the roundness of a structure. Feret = 1 is round, Feret = 0 is a line. Use the slider to adjust the Feret value. |
|
Rotation |
Sets the rotation deviance of structures from the main direction. Use the slider to adjust the deviance value. |
|
Opacity |
Only available for Layer Thickness Measurement with Intellesis. |


See also
ON THIS PAGE
- Layer Thickness Measurement
- The Concept
- General Preparations
- General Analysis Workflow
- Layer Thickness Measurement
- Layer Thickness Measurement with Intellesis
- Adaptation of Detected Edges
- Layer Thickness Measurement Workbench
- Layer Chord Editing Tool
- Layer Thickness Measurement Setup Tool
- Preprocessing Settings Tool