Tools
Image Selection Tool
With this tool you select an image and display the results of all jobs you ran in a table in the Result View.
|
Parameter |
Description |
|---|---|
|
Statistics |
To display the statistical results, click Statistics. The results are displayed in a table containing detailed parameters. For DIN EN ISO 643 (2024) the following applies: When the Operator runs the Job, the software checks the magnification of the image. In case the magnification is other than the default value (100x), the determined values are recalculated. Both tables with G values are displayed: On the left side the determined value and on the right side the calculated value for the selected magnification. The right table will be archived and displayed in the report. |
|
Image <No.> |
To display the images in the center screen area, click on the image. To exclude an image, hover over the desired image and click Exclude. The excluded image is not included in the statistics calculation. |
See also
Check Scaling Tool
This tool checks if the image has scaling information.
|
Parameter |
Description |
|---|---|
|
All checks passed |
A message is displayed if the scaling information is not available. |
|
Ignore notice |
Activated: The message will be ignored and not displayed. |
Frame Setup Tool
This tool enables you to set up a measurement pattern type for the analysis of grain with the intercept method.
|
Parameter |
Description |
|
|---|---|---|
|
Pattern Type |
The selected pattern will be superimposed on the image. By using the controls you can adjust the pattern according to the image. The number of grain boundary intersections along the lines and circles is counted to calculate the average grain size. |
|
|
– |
Hilliard Single-Circle Procedure |
One circle is superimposed on the image. This procedure is useful when the grain shape is not equiaxed but has been distorted by deformation or other processes. |
|
– |
Abrams Three-Circle Procedure |
Three concentric circles are superimposed on the image. The procedure is useful for materials with non-equiaxed grains or those that have been deformed. |
|
– |
Heyn Lineal Procedure |
One to 50 straight lines are superimposed on the image. |
|
– |
Random Lines |
Lines are superimposed randomly on the image. |
|
– |
Combined Lines |
Four lines are superimposed on the image in a systematic pattern to ensure comprehensive coverage. |
|
– |
Combined Pattern |
Combined lines in addition with the Abrams Three-Circle pattern are superimposed on the image. |
|
Scaling |
Default value: 75% Sets the scaling factor in a range from 5% to 90%. |
|
|
Angle |
Sets the angle of the pattern. Only available for the following pattern types:
|
|
|
Count |
Sets the number of patterns. Only available for the following pattern types:
|
|
|
Pattern Color |
Sets the color of the pattern on the image. |
|
|
Pattern Width |
Sets the widths of the pattern on the image. |
|
Image Segmentation (Intercept) Tool
With this tool you set the image segmentation settings for Grain Size Analysis with intercept method.
|
Parameter |
Description |
|---|---|
|
Threshold |
Optimized the results of the detection |
|
Auto |
Starts the detection. |
|
Dark Grains |
Activate for dark field images, grain boundaries are displayed white. |
|
Center of Grains |
Activated: The center of the grains will be used as measurement points instead of the intersections with the grain boundaries. |
Image Segmentation (Planimetric) Tool
This tool uses different parameters for grain detection. There are four parameters to adjust. If you are in the Grain Size Analysis (Planimetric) workflow, the software automatically provides default values.
Foreign Phase Section
|
Parameter |
Description |
|
|---|---|---|
|
Threshold |
||
|
– |
Reset |
Clears the upper and lower thresholds. No pixels are considered. |
|
– |
Undo |
Undoes the last change made to the threshold values. |
|
– |
Redo |
Restores the last undone change to the threshold values. |
|
– |
Low |
Sets the lower threshold. Only pixel values above this value are considered. The range of possible values depends on the bit depth of the image. |
|
– |
High |
Sets the upper threshold. Only pixel values below this value are considered. The range of possible values depends on the bit depth of the image. |
|
– |
Invert |
Only pixels outside the threshold boundaries are considered, i.e. those pixels below the lower threshold and above the higher threshold. |
|
– |
Full Range |
Sets the lower threshold to 0 and the upper threshold to the highest value (depending on bit depth). The entire range of pixel values is considered. |
|
HISTOGRAMM |
Changes the lower and upper threshold value for the activated value. Drag the lower or upper adjustment handle or shift the entire highlighted area between the lower and upper threshold value. |
|
Grain Detection Parameters Section
|
Parameter |
Description |
|
|---|---|---|
|
Boundaries Type |
||
|
– |
Dark grain boundaries |
|
|
– |
Light grain boundaries |
|
|
– |
Color Etching |
|
|
Sigma |
Default: 0,5 Rough Adjustment |
|
|
Threshold |
Default: 0,17 Rough Adjustment |
|
|
Maximum Area |
Default: 51 Fine Adjustment |
|
|
Smoothing |
Default: 5 Fine Adjustment |
|
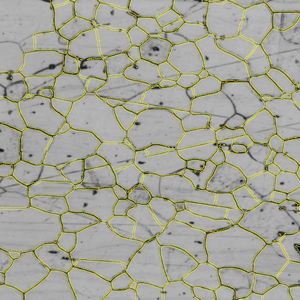
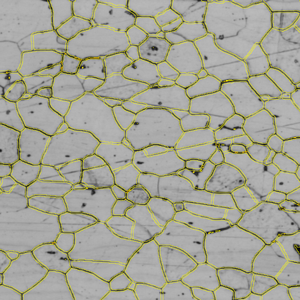
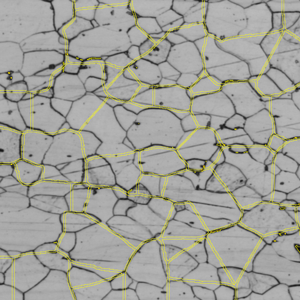
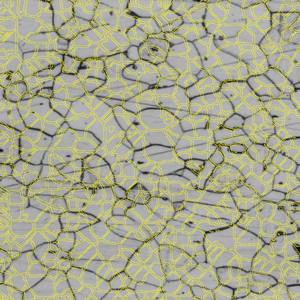
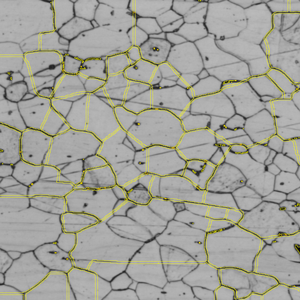
Algorithm for Grain Detection Parameters
Sigma
This parameter uses the Valleys Tool to specify the extent of smoothing to the input image before the lines of dark pixels are detected. Values lower than the default values lead to the detection of finer grains. Higher values lead to detection of coarse grains.
|
Parameter Low |
Default |
Parameter High |
|
|
|
|
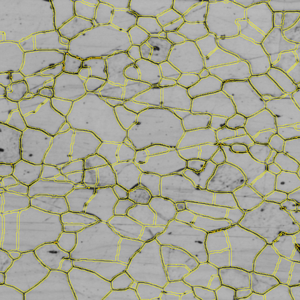
Threshold
This parameter uses the Valleys Tool to specify the steepness a valley must possess to be recognized by the tool.
Values lower than the default values lead to the detection of finer grains. Higher values lead to detection of coarse grains.
We recommend moving the slider only in the front fifth of the bar to adjust the analysis results. Excessive deviations of the values from the default values distort the analysis results.
|
Parameter Low |
Default |
Parameter High |
|
|
|
|
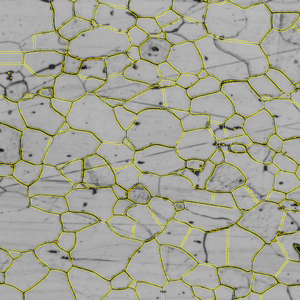
Maximum Area
This parameter uses the Scrap Tool to remove foreground structures (white) from the current image, depending on the size of the structures.
Values lower than the default values lead to the detection of finer grains. Higher values lead to detection of coarse grains.
We recommend moving the slider only in the front third of the bar to adjust the analysis results. Excessive deviations of the values from the default values distort the analysis results.
|
Parameter Low |
Default |
Parameter High |
|
|
|
|
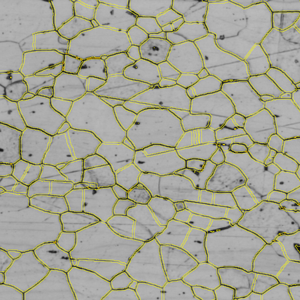
Smoothing
This parameter uses different Tools in a certain order:
- The NOT Tool is applied to invert the image.
- The Distance Tool is applied to create a distance map from the image.
- The NOT Tool is applied to invert the image.
- The Lowpass Tool is applied to reduce noise in the image.
Values lower than the default values cause the selected grain boundaries to become straighter and more angular. Higher values round off the detected grain boundaries.
We recommend that you do not change the default value or change it only slightly in the front area of the bar. Excessive deviations of the values from the default values distort the analysis results.
|
Parameter Low |
Default |
Parameter High |
|
|
|
|
Interactive Image Segmentation (Intercept) Tool
This tool displays the grain size number and the number of intersections in correlation with the pattern type. To add or remove intersections, in the center screen area, click on the pattern.
|
Parameter |
Description |
|---|---|
|
Grain Size Number |
Displays the grain size. |
|
Number of Intersections |
Displays the number of intersections and the minimum number depending on the pattern type. If the minimum recommended number of the required intersections, according to the standard and pattern, is reached, a green dot is displayed. A red dot indicates that the minimum number is not reached. |
|
Undo |
Removes the marked intersection. |
|
Redo |
Restores the previous marking. |
See also
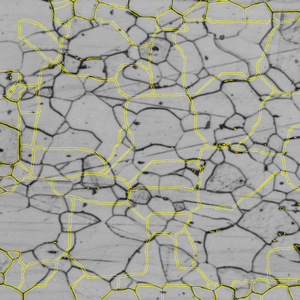
Interactive Image Segmentation (Planimetric) Tool
With this tool you cut or merge boundaries by using the tools in the Edit Regions section, see Interactive Segmentation.