ZEN Connect
This module enables you to work with images from multiple sources: zoom in from the full macroscopic view of your sample down to nanoscale details. ZEN Connect is the efficient way to analyze and correlate images from multiple sources. It works with images from SEM, FIB-SEM, X-ray, light microscopes and any optical images, e.g. from your digital camera. Its sample-centric workspace lets you build a seamless multimodal, multiscale picture of your sample. Use it to guide further investigations and target additional acquisitions.
Understand your sample fully. ZEN Connect employs a novel graphical user interface concept that makes it easy to investigate all your samples. Design a workflow tailored precisely to the complexity of your experiment, no matter whether it’s a simple one-step task or a compound experiment. A sophisticated workflow environment guides you all the way from the setup for automated acquisition to post processing and customized exports, and right on through to analysis.
ZEN Connect lets you manage, align, and export images in correlation with images from other sources.
Licensing and Functionalities of ZEN Connect
For working with ZEN Connect projects or images, you might need a separate license file. The basic ZEN Connect functionality is available for all versions. This functionality includes:
- ZEN Connect correlative workspace, including the display of images with their context.
- Manual alignment of captured images.
- Auto-registration of images using stage coordinates.
- Image acquisition into the project.
- Import of images into the correlative workspace.
- Interactive control of stage movement from the correlative workspace.
Licensed Functionality
If you have the necessary license, additional functionality is available.
- Import of Third-party images (Bio-Formats).
- Export of a ZEN Connect view as a single image.
- Movie export as fly-through video.
- S&F calibration.
- Definition of regions of interest in the correlative workspace.
- Retrieval of defined regions of interest.
Loading an Image and Adding it to the ZEN Connect Project
You can add simple images, such as camera images or more complex images, such as a light microscope image with overlays, into your ZEN Connect project.
You can use an imported image as a backdrop to navigate the region. You can correlate imported images with sample holder marks, e.g. fiducials or other images through the alignment process. The imported image is displayed according to its position in the Graphical view along with any other image in the project. ZEN Connect saves the results to the archive. You can restore results from the archive.
Any time you open an image with the Load Image or the Load image from ZEN Data Storage tool, it is added to the ZEN Connect project.
Open the ZEN Connect workbench before performing a S&F calibration.
- You have opened a ZEN Connect project.
- On the Load File workbench, add the Load Image tool or the Load image from ZEN Data Storage tool if you want to add an image from the Data Storage.
- Click on the browse button
 to select an image in the respective tool.
 - In case of the Load Image tool, the usual Windows explorer opens to select the image. For the Load image from ZEN Data Storage tool, the Browse ZEN Data Storage dialog opens. It displays all images in the data storage and you can search the images and also sort the list of images, e.g. by name, size, etc.
- Click on Open or OK to confirm your selected image.
- Click on Apply.
- The image is loaded and displayed in the Image view. It is also displayed in the Documents Area on the right.
- In the Project view, the image is displayed in the tree, subordinated to Imported Data unless it contains session information.
- If Shuttle & Find-calibration is available for the image, the image is placed in the Image view according to the Shuttle & Find stage position. Take care that you select the correct sample holder when importing an S&F-calibrated image. The correct sample holder is the same sample holder that was used during acquisition. If no Shuttle & Find data is available, the image is displayed in the Image view according to its stage coordinates.
Non Image Data
In Zen Connect, it is also possible to import (via drag & drop) non image data into your project, have a visual representation (marker) of it in your image area, and align the position of the data marker with respect to the images in the project. The data is listed under Non-Image Data in the tree of the ZEN Connect tool and represented by this marker in the image area:
Per default, the marker for this non image data is toggled invisible. To toggle data visible and invisible, see Toggling the Visibility of Data.
EDS spectral images
EDS spectral images contain specific metadata that determine their handling in a ZEN Connect project. If you add EDS spectral images to a ZEN Connect project, they are added as non image data because they have the special document subtype metadata ChartImageDocument. In this case the marker is visible by default. EDS spectral images are also placed at a certain position in the ZEN Connect project, determined by the SpatialRelations and Scaling metadata information.
See also
Raman Images
If you have licensed ZEN Connect, the software supports the display of images with the specific Horiba LabSpec HDF5 Raman image format. These supported images basically represent a map (score map) of intensities of the different channels. This means the higher the concentration of a detected material, the higher the displayed color saturation. To display the data the image codec HDF5 is used.
HDF5 is only used as a standard image codec to display this specific type of image (Horiba LabSpec HDF5 Raman image format) and is not a HDF5 import!
Display of Raman Images
- The image can be opened just as any other image. In the file explorer, make sure that the file type is set either to HDF5 (*h5) or to Image files. Then the file(s) with the Horiba LabSpec HDF5 Raman image format can be selected.
- The files of this format can only be displayed, but changes to the image cannot be saved. To save the file after changing parameters (e.g. the image display curve), you have to save the image in another format like *.czi.
- To display the image(s) the FLOAT values of the original file are converted or mapped to 16 bit format. Exception: If the values in the file contain constant, NAN or INF values, no conversion to 16 bit is done.
Selecting and Clearing Carrier/Holder
The sample is usually mounted on a carrier or directly on a sample holder. Select the appropriate sample holder for your configuration when you configure your project.
We offer specific sample holders and carriers with certain markers, e.g. "L"-markers or others. These CorrMic sample holders are necessary for a Shuttle & Find workflow. Note: If you change the carrier/holder after a S&F calibration, the S&F calibration needs to be redone.
- You have loaded a ZEN Connect project.
- In the button bar above the Image view, click the Select Carrier/Holder drop-down list.
- The Select Template dialog opens.
- Select a template you want to add to your ZEN Connect project and click OK.
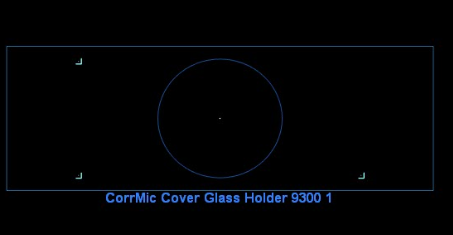
- The frame of the selected template is displayed in the Image view of your ZEN Connect project.
- To deselect the carrier/holder, click the Select Carrier/Holder drop-down list and select Clear/Carrier Holder.
Toggling the Display of Region Caption and Frame
For a better overview, you can toggle the display of the image name and of the frame of images in the Image view of your ZEN Connect project.
- You have loaded a ZEN Connect project.
- To toggle the region caption, in the button bar above the Image view, click Toggle Region Captions
 .
.
- The region caption of the images are displayed or hidden.
Toggling the Visibility of Data
In the ZEN Connect tool you can toggle the visibility of data in the Project view as well as in the Layer view.
Project View
- Right-click the image or non image data in the ZEN Connect tool and select Show/Hide. Alternatively, right-click the image or non image data marker in the image area and select Show/Hide.
- You have toggled the data visible/hidden.
Layer View
- Click on the eye icon on the right of the data.
- The data is toggled visible
 or hidden
  .
.
Selecting Region
You select a region to later apply the Alignment Mode to the image contained in this region.
- You have loaded a ZEN Connect project.
- In the button bar above the Image view, click Select Region
 .
.
- The image in the selected region is activated.
- Both in the Project view and in the Layers view, the image within the selected region is highlighted.
Panning & Zooming
- You have loaded a ZEN Connect project and activated the alignment process.
- In the button bar above the Image view, click
 .
.
- With your mouse, or alternatively, with the pressed Ctrl key, you can pan and zoom in and out in the Image view.
Toggling View Modes
In ZEN Connect you can switch between two different view modes for your projects. The default is the carrier or holder view mode, where the coordinate system of the correlative workspace is aligned with the screen and images on the current system might be rotated. The second is the stage centric view mode, where the coordinate system of the current session and Field of View is aligned with the screen and the sample as well as other sessions might be rotated.
- You have opened a ZEN Connect project.
- In the button bar above the Image View, click on the button for the carrier/holder view mode
 or the stage centric view mode
  .
.
- The view is changed according to the selected view mode.
Adding Measurements to a ZEN Connect Project
- You have loaded a ZEN Connect project.
- You have added the Measurements tool to the ZEN Connect workbench.
- In the Measurement tool, click on the button for the respective measurement tool.
- In the image view, click to set the points for the measurement. For a distance measurement, set two points, for an angle three and for an area measurement create a polygon that covers the desired area.
- In case of area measurements, the last click has to be at the first point to "close" the polygon. Alternatively, click with the right mouse button to finish the polygonal area.
- The respective measurement is displayed in the view as well as the table of the Measurement tool.
- You have added a measurement to your ZEN Connect project.
Editing Measurements in a ZEN Connect Project
- You have opened a ZEN Connect project and added a measurement, see Adding Measurements to a ZEN Connect Project.
- In the button bar above the Image view, click
 .
. - You are now in edit mode.
- To resize measurements, click on the end points of a measurement to drag and drop them. In case of an area measurement, you cannot rescale the contour.
- The measurement values are updated instantly.
- To move a measurement, drag and drop the respective measurement in the Image view.
- To change the Name of a measurement, in the Measurement tool, double click the current name in the table.
- The name in the field gets editable.
- Enter the desired name and press Enter.
- The measurement is renamed.
- To toggle the visibility of a measurement, click for the respective entry in the list.
- The measurement is toggled (in-)visible.
- To delete a measurement, select the measurement in the list and click
 . Alternatively, select the measurement and press Del.
 - The measurement is deleted.
Using the Global-Z slider
In ZEN Connect you can use a mode called Global-Z if you have a project with at least one z-stack. In this mode, you can change the displayed z plane of all z-stacks in the project with only one slider, the Global-Z slider. The range of the slider is comprised of the z values of all stacks in the project. The displayed slice for each stack is always the one closest to the value set by the Global-Z slider, as long as the value is within the boundaries of the entire stack. When you use the Global-Z slider and are beyond the range of a certain z-stack, only a frame is displayed to show where the stack is positioned.
Note: If you have selected a particular z-stack, the Global-Z and Z-Position sliders are interdependent. Changing the value with one slider updates the other slider as well.
- You have one or several z-stacks in the ZEN Connect project.
- Activate the Global-Z checkbox on the Dimensions tab.
- Use the slider or the input field to set a global value for z.
- All the slices closest to the set value are displayed for all z-stacks. Z-stacks which are out of range are illustrated by an empty frame.
Creating a Snapshot of the Workspace
- You have opened a ZEN Connect project.
- Prepare the view according to your needs, e.g. zoom to a desired area, or hide images that should not be visible in the snapshot.
- In the button bar above the Image View, click
 .
.
- A snapshot of the current view in the workspace is created. In Free Mode, the snapshot image is added to the gallery on the right. In Job Mode, the snapshot image is added to the job result.
Field of View Width Dialog
|
Parameter |
Description |
|---|---|
|
FOV Width |
Displays the current width of the field of view and allows you to enter a value. |
|
OK |
Sets the width to the entered value. |
|
Cancel |
Closes the dialog box without setting the field of view. |
Pixel Size Dialog
|
Parameter |
Description |
|---|---|
|
Pixel Size |
Displays the current pixel size and allows you to enter a value. |
|
OK |
Sets the pixel size to the entered value. |
|
Cancel |
Closes the dialog box without setting the pixel size. |
ON THIS PAGE
- ZEN Connect
- Licensing and Functionalities of ZEN Connect
- Loading an Image and Adding it to the ZEN Connect Project
- Non Image Data
- Raman Images
- Selecting and Clearing Carrier/Holder
- Toggling the Display of Region Caption and Frame
- Toggling the Visibility of Data
- Selecting Region
- Panning & Zooming
- Toggling View Modes
- Adding Measurements to a ZEN Connect Project
- Editing Measurements in a ZEN Connect Project
- Using the Global-Z slider
- Creating a Snapshot of the Workspace
- Field of View Width Dialog
- Pixel Size Dialog