Result View
The Result View displays the grain size analysis results containing the original and the analyzed images. In the INSTRUCTION drop down, a message is shown if the standard prescribes a certain number of images or grains to be analyzed and if these conditions are met.
The data displayed in the Result View depend on the used method.
|
1 |
Image Selection tool - Statistics Displays the statistics of your analysis. Click to switch the displayed images and the statistics in the center screen area, see Image Selection Tool. |
|
2 |
Image Selection tool - Image Displays the selected image and the analyzed image. Click to select and to switch the images and the statistics in the center screen area. You can exclude iterations or loops you do not want to have displayed within the result and the report. The activated image has got a blue frame. See Image Selection Tool. |
|
3 |
Result View In this example, in the center screen area, the image with selected pattern and the intersections is displayed. In a table, detailed parameters are listed. In the next step, the report is generated. |
Result View Comparison Method Workflow
The result view of an analysis using the comparison method displays the original and the selected comparison image.
|
1 |
Image Displays the image. |
|
2 |
Selected Chart Displays the selected comparison image. |
|
3 |
Additional Results Displays statistics, here, the size of the comparison chart is displayed. |
To display all statistics in a table, in the Image Selection tool, click Statistics, see Image Selection Tool.
Standard DIN EN ISO 643 - 2024
The table displays the image name and the chart size of the selected comparison chart. From three samples onwards, the mean G value is displayed.
Result View Intercept Method Workflow
The result view of an analysis using intercept method displays the original and the analyzed images.
|
1 |
Image Displays the image. |
|
2 |
Analyzed Image Displays the selected comparison image. |
|
3 |
Parameters Displays statistics, here, the Grain Size No., the Number of Intersections and the Pattern Length. |
To display the overall results and the following additional parameters instead of the images, in the Image Selection tool, click Statistics:
- Mean Grain Size No.
- Standard Deviation
- Confidence Interval
- Relative Accuracy
- Number of Images
- Number of Grains
- Exact Value
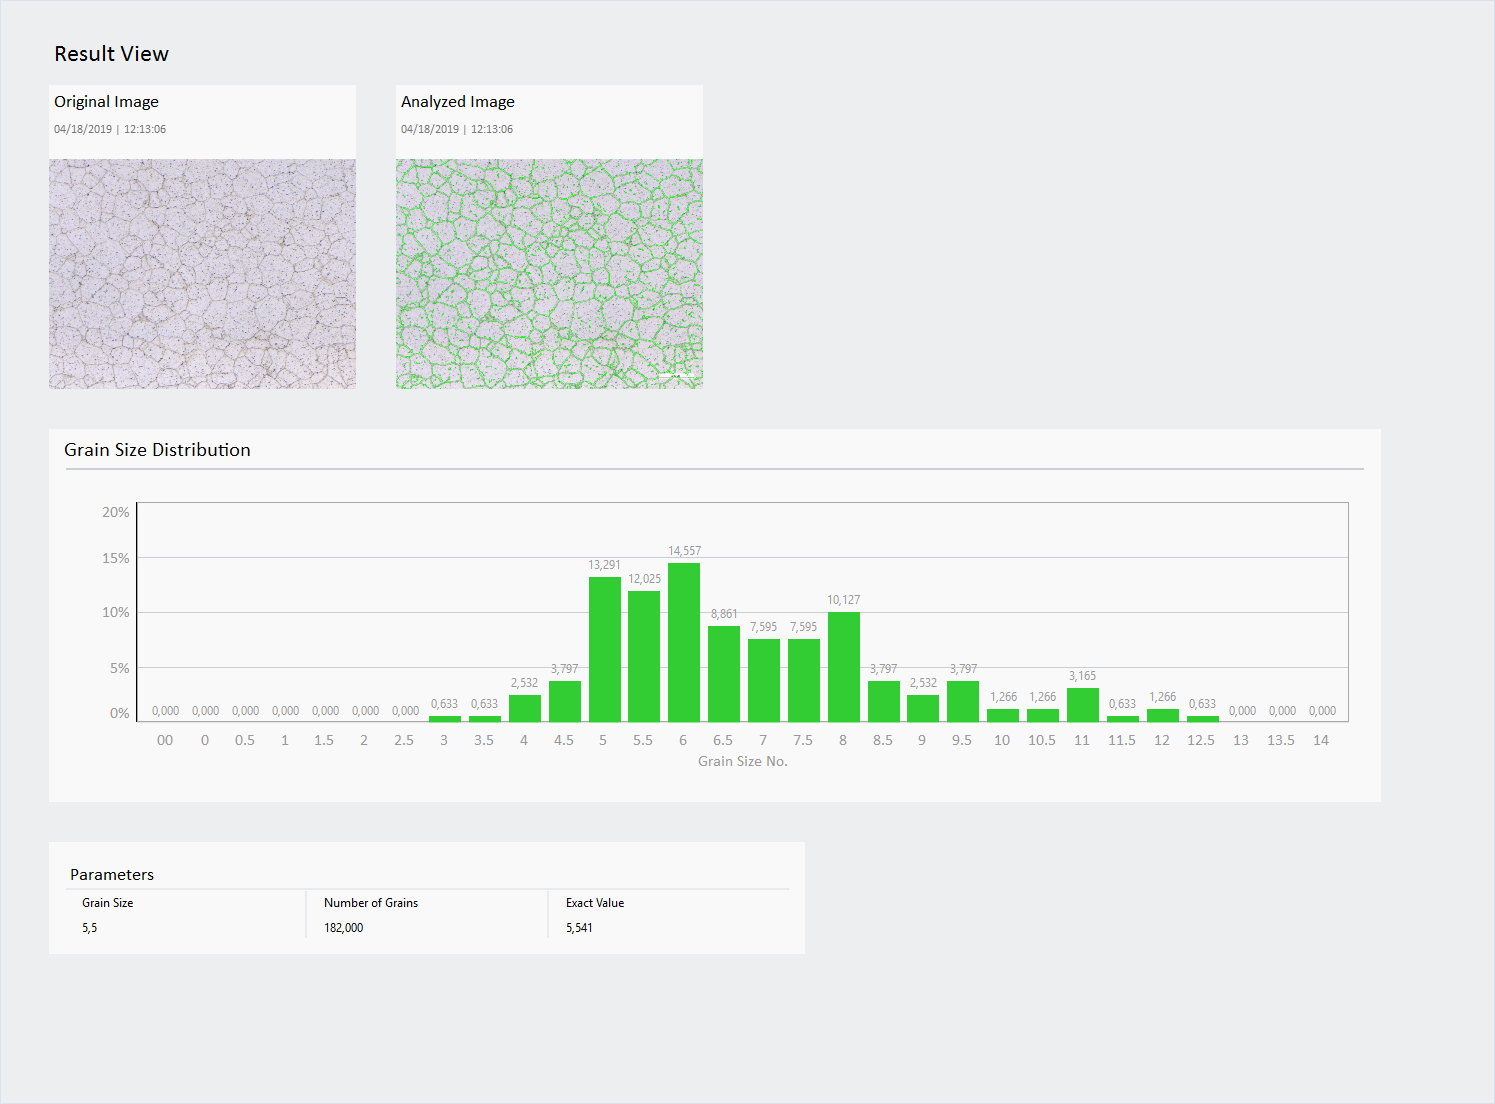
Result View Planimetric Method Workflow
The result view of an analysis using planimetric methods displays the original and the analyzed images and the distribution of the grain size.
- Grain Size Analysis (Planimetric)
- Grain Size Analysis - AI Instance Segmentation - (Planimetric)
- Grain Size Analysis - Deep Learning - (Planimetric)
- Grain Size Analysis - Intellesis - (Planimetric)
|
1 |
Original Image Displays the image. |
|
2 |
Analyzed Image Displays the selected comparison image. |
|
3 |
Grain Size Distribution In a diagram, on the x-axis the grain size classes are displayed and on the y-axis the number of grains for the respective class in percentage. |
|
4 |
Additional Results Displays statistics, here, the Grain Size, the Number of Grains and the Exact Value. |
To display the overall results and the following additional parameters instead of the images, in the Image Selection tool, click Statistics:
- Mean Grain Size No.
- Standard Deviation
- Confidence Interval
- Relative Accuracy
- Number of Images
- Number of Grains
- Exact Value
Result View of Analysis Workflows with Trained Models
The result view of an analysis using trained models displays the original and the analyzed images and the distribution of the grain size. In the diagram, on the x-axis the grain size number classes are displayed and on the y-axis the number of grains for the respective class in percentage.
This description applies to the following workflows:
- Grain Size Analysis - AI Instance Segmentation - (Planimetric)
- Grain Size Analysis - Deep Learning - (Planimetric)
- Grain Size Analysis - Intellesis - (Planimetric)
For the description of the Result View with any planimetric method, see Result View Planimetric Method Workflow.
To display the overall results and the following additional parameters instead of the images, in the Image Selection tool, click Statistics:
- Mean Grain Size No.
- Standard Deviation
- Confidence Interval
- Relative Accuracy
- Number of Images
- Number of Grains
- Exact Value