Comparative Diagrams
This module enables you to compare microscope images with chart series from the most important standards available. The following standards are supported:
|
Application |
Standard |
|---|---|
|
Grain Size Analysis |
|
|
Cast Iron Analysis |
|
|
NMI Analysis |
|
The software will be shipped including the following functionality:
- Comparative Diagrams
- Using this workflow you can perform image comparison according to the available standards. Usually an image acquisition is performed followed by the comparison of the acquired (or loaded) image and the charts series from the desired standard, see Comparative Diagrams.
- Comparative Diagrams Live
- Using this workflow you can directly compare the live image from the microscope with the chart series from a selected standard, see Comparative Diagrams Live.
- Chart Series Creator
- Using the chart series creator you can create your own, customized chart series for comparing them with your images. This is helpful if you do not want to work with the default charts from the standards but use your own individual comparison images, see Chart Series Creator.
Please make yourself familiar with the common functions and operating principles of the software before you start working with the module. We recommend to read the full Online Help and User Manual carefully in addition to the specific chapters concerning this module.
See also
The Concept
The Comparative Diagrams module allows the comparison of a microscope image with images (chart series) from standard-based comparative diagrams. The result contains the original image and the selected chart.
Every analysis is managed within the archive as an independent project. The results can be printed in the form of a report.
Working with the module can be divided into three task areas:
- Creating & Managing Jobs (Supervisor)
As Supervisor you set up the workflow for the comparison: e.g. specify the input form and job template. - Running Jobs (Operator)
- As an Operator you can perform the comparison workflow that was pre-defined by an Supervisor.
- Creating user defined chart series
- Within the Chart Series Creator you can create own, customized chart series.
Please make yourself familiar with the common functions and operating principles of the software before you start working with the module. We recommend to read the full Online Help and User Manual carefully of course in addition to the specific chapters concerning this module.
See also
General Preparations
Two pre-defined job templates are included in the software, when you have licenced the Comparative Diagrams module. You can modify the job template, see Working with Job Templates.
As a Supervisor you can access/edit the job template under Manage Templates. On the left side in the Categories list under Material Modules select Comparative Diagrams.
In the templates list you see the two available job templates. Select an entry in the list, and from the context menu, open the corresponding job template. The job templates always contain three major tasks:
|
1 |
Filling out an Input Form In this step the operator has to fill out the input form with user and sample specific information, e.g. Sample Information, User Name, etc. |
|
2 |
Performing the Analysis In this step the analysis will be performed according to the selected method. The detailed workflow will be described in the following chapters. |
|
3 |
Creating a Report After the analysis a report will be generated containing the job results (images, measurements, etc.). |
General Workflow
The analysis steps of the workflow contain the following substeps to be executed. In this example the substeps are created within a Loop Task , meaning all included steps will be repeated depending on the loop settings. Regarding this you can easily fulfill the normative requirements of repeating the identical steps of an analysis for several times.
|
Workflow Step |
Description |
|
|---|---|---|
|
Loading an Image (2) |
Load your image you want to compare with a chart. The workflow can be adapted to perform image acquisition tasks here as well. |
|
|
Processing the Image (3) |
Perform improvements on the image, e.g. change Brightness, Contrast and/or Gamma. |
|
|
Performing the Comparison |
Set up and perform the image comparison with an acquired or loaded image. Select the matching chart image from the standard. |
|
|
Performing the Comparison LIVE |
Set up and perform the image comparison with a live image from the microscopy camera. Select the matching chart image from the standard. |
|
|
Showing the Results View |
The Results View is displayed containing the microscope image and the selected chart image as well as a resulting table containing the detailed parameters. |
|


Comparative Diagrams
This topic explains the specific comparison part of the Comparative Diagrams job template which is delivered with the software. We recommend that you read the sections General Preparations and General Analysis Workflow to make yourself familiar with the general workflow.
Image Comparison
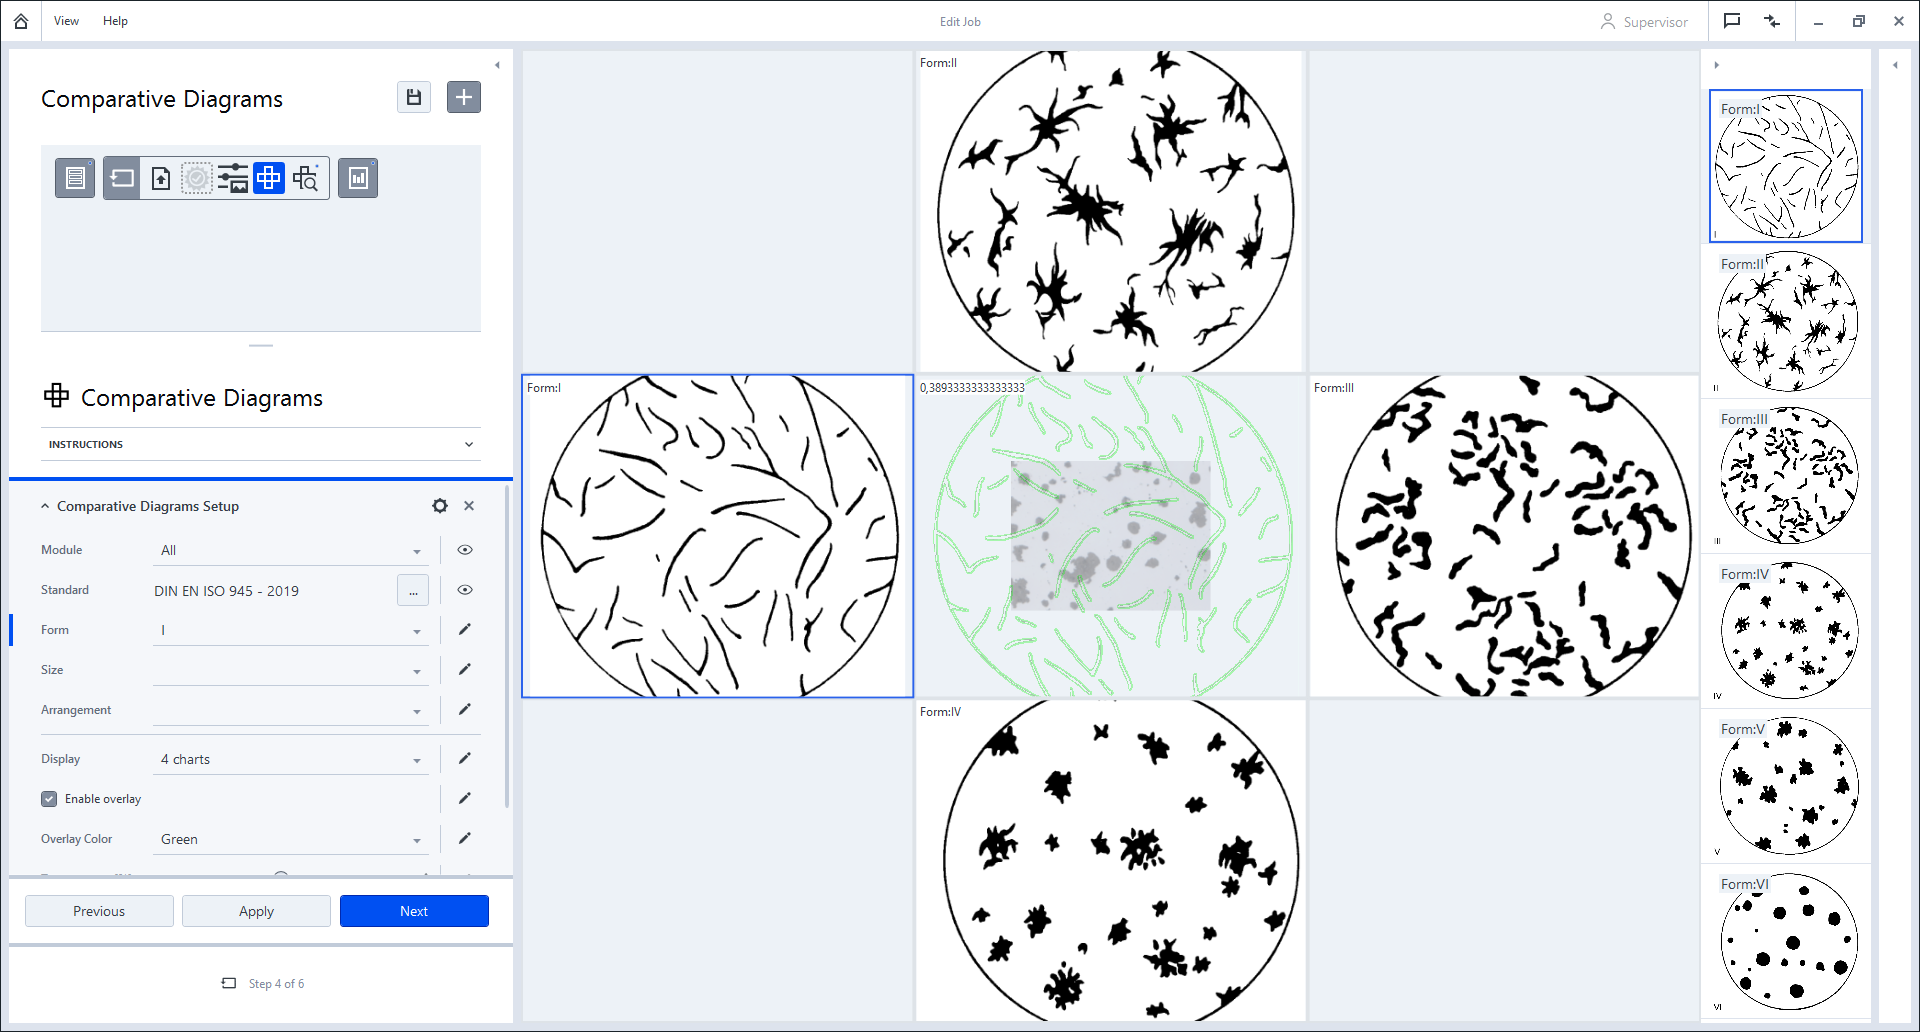
Comparing the microscope image with chart images from a standard is the central part of the Comparative Diagrams workflow. By the help of the Comparative Diagrams Setup tool in the left tool area you have all parameters available to select the desired application and standards. You can adapt the comparison view to perfectly fit your requirements.
The image inside the blue frame is the image that will be used as the matching chart image. On the very right side of the window you find a gallery containing all chart images which are available for the selected standard. If you click on an image, it will be positioned in the blue frame. To select another image, click on it and it will replace the previous selected image.
See also
Comparative Diagrams Live
This topic explains the specific comparison part of the Comparative Diagrams Live job template which is delivered with the software. We recommend that you read in advance the sections General Preparations and General Analysis Workflow to make yourself familiar with the general workflow.
Live Image Comparison
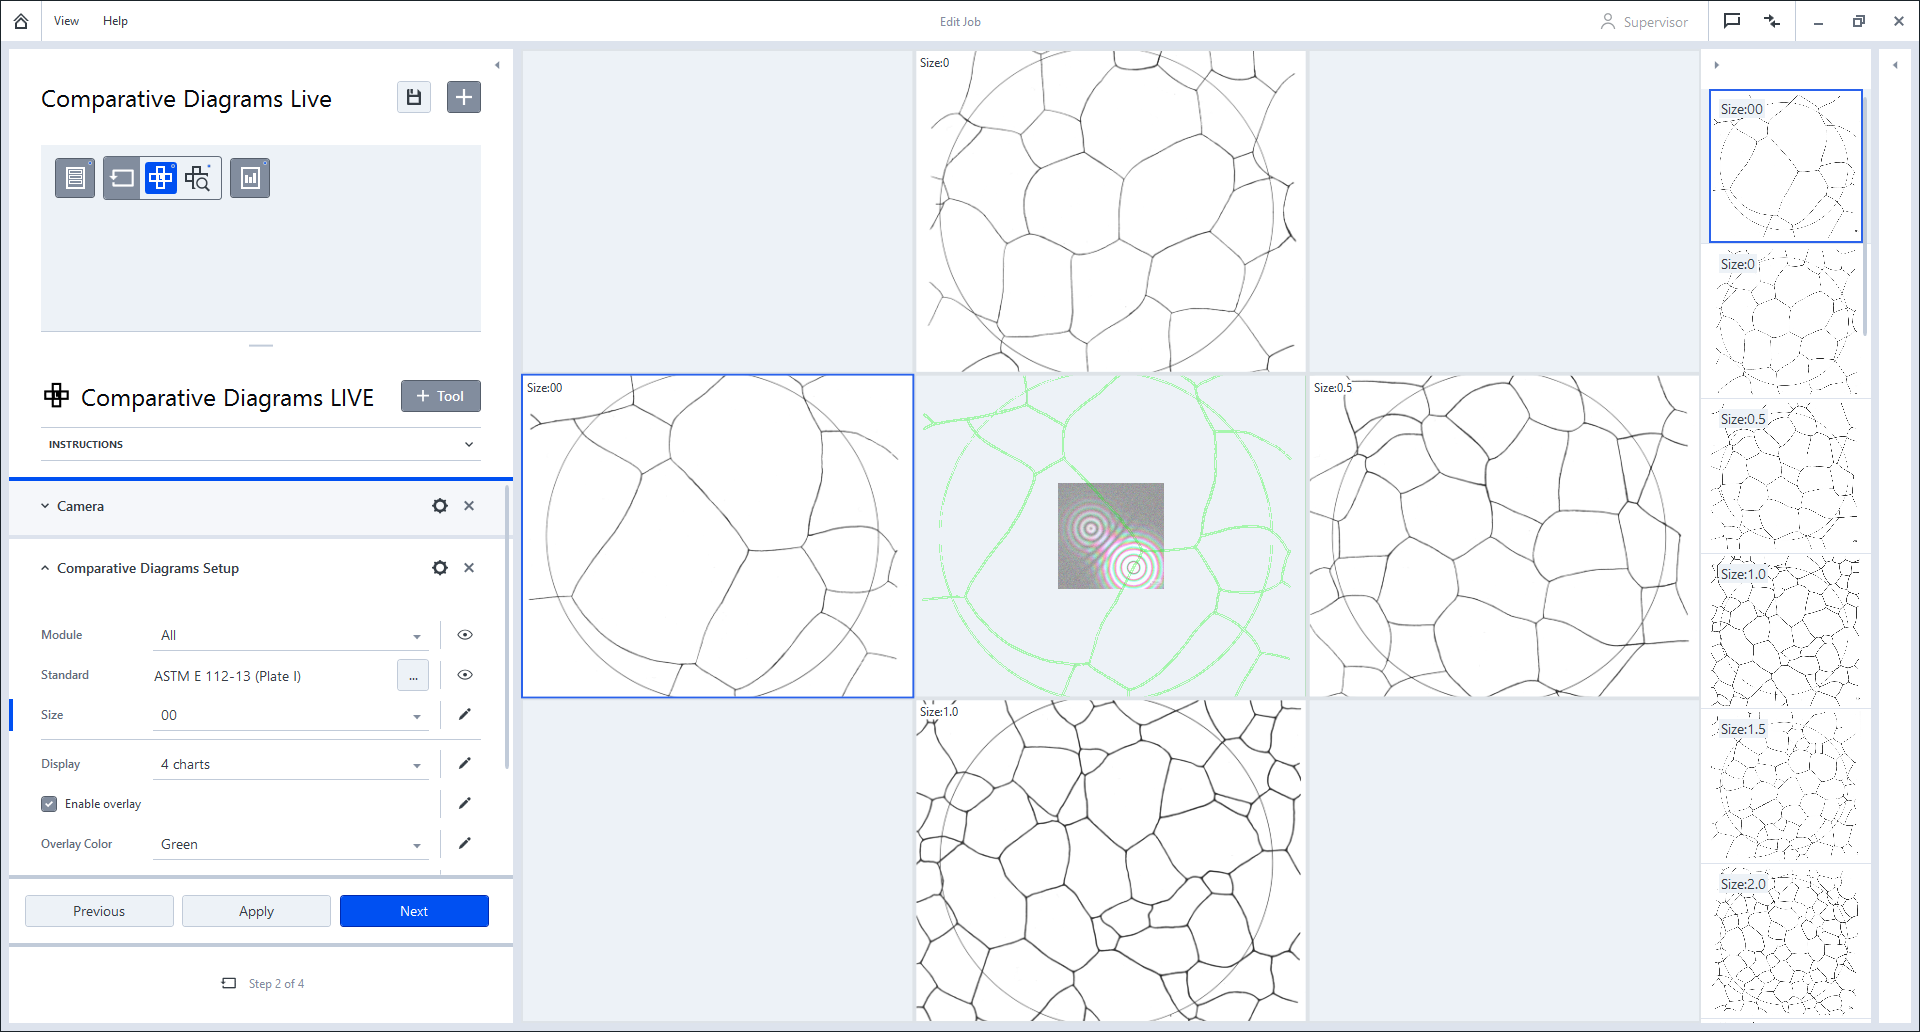
Comparing the live microscope image from the microscope camera with chart images from a standard is the central part of the Comparative Diagrams Live workflow. With the Comparative Diagrams Setup tool in the left tool area you have all parameters available to select the desired application and standards. You can adapt the comparison view to perfectly fit your requirements.
The image inside the blue frame is the image that will be used as the matching chart image. On the very right side of the window you find all chart images which are available for the selected standard. If you click on an image, it will be positioned in the blue frame. To select another image, click on it and it will replace the previous selected image.
See also
Chart Series Creator
Within this dialog you can see the available standards for the Comparative Diagrams module and you can create your own, customized chart series.
- Chart Series (User defined)
- When you double-click on the entry New Chart Series a wizard will be opened to help you creating a chart series. Once you have created a new chart series, it can be used in the Comparative Diagrams module to compare it with microscope images.
- Chart Series (Standards)
- The list shows the available standards provided with the software. They can be used in the Comparative Diagrams module to compare microscope images with chart series from the desired standard. Note that the chart series from the standards cannot be modified or edited.
On the right side of the standards list you see basic properties like Name, corresponding Application, Description and the relevant Dimensions.
See also
Chart Series Creator Wizard
Using this wizard you can create your own, customized chart series. You can easily navigate through the wizard steps by using the Next and Back buttons available. The wizard contains the following 4 steps:
Step 1/4 Enter basic information
Within the first step you can enter basic information like Name, Description and the Module, for which the chart series should be used. Click on Next to continue.
Step 2/4 Define dimensions & values
Within this step you define the Dimensions and the corresponding Values of your own chart series. By clicking on the + Add buttons below, for each list a new dimension or value is added. If you have finished your individual definition, click on Next.
Step 3/4 Add images
Now you have to add the images (charts series) you want to use for the comparisons. Again click on the + Add button to add the desired images.
Step 4/4 Assign values to images
Within this step you have to assign values to the corresponding images. You can assign the images by dragging & dropping the corresponding value fields on the box.
Comparative Diagrams Setup Tool
|
Parameter |
Description |
|
|---|---|---|
|
Module |
Displays the module you are using for the compare. Depending on the module, specific standards and parameters are available. |
|
|
Standard |
Here you set or load the desired standard including the comparison images you want to use for the compare. |
|
|
Size |
The displayed parameters depend on the charts. For Grain Size Analysis it is size, for other charts it is different, for example, for ISO 945 it is form, size, arrangement. Note: For DIN EN ISO 643 - 2024 the image on the right is scaled to the left with a factor given by the loaded or acquired image magnification. |
|
|
Display |
Selects up to 5 different settings for displaying the image and the comparative images. |
|
|
- |
Enable Overlay |
If activated, an overlay image of the selected comparative image and the sample image is displayed. |
|
Overlay Color |
Selects a certain color for the overlay image. |
|
|
Transparency |
Adjusts the transparency of the overlay image from 0-100%. |
|
See also
Comparative Diagrams Results Workbench
This workbench opens the Comparative Diagrams Results view.
See also
Comparative Diagrams Results View
The Result View is displayed containing the microscope image and the selected chart image as well as a resulting table containing the detailed parameters. In the Image Selection tool, you can exclude images from the Result View and display statistics.
|
1 |
Microscope image |
2 |
Parameters |
|
3 |
Selected chart |